Figure 6.

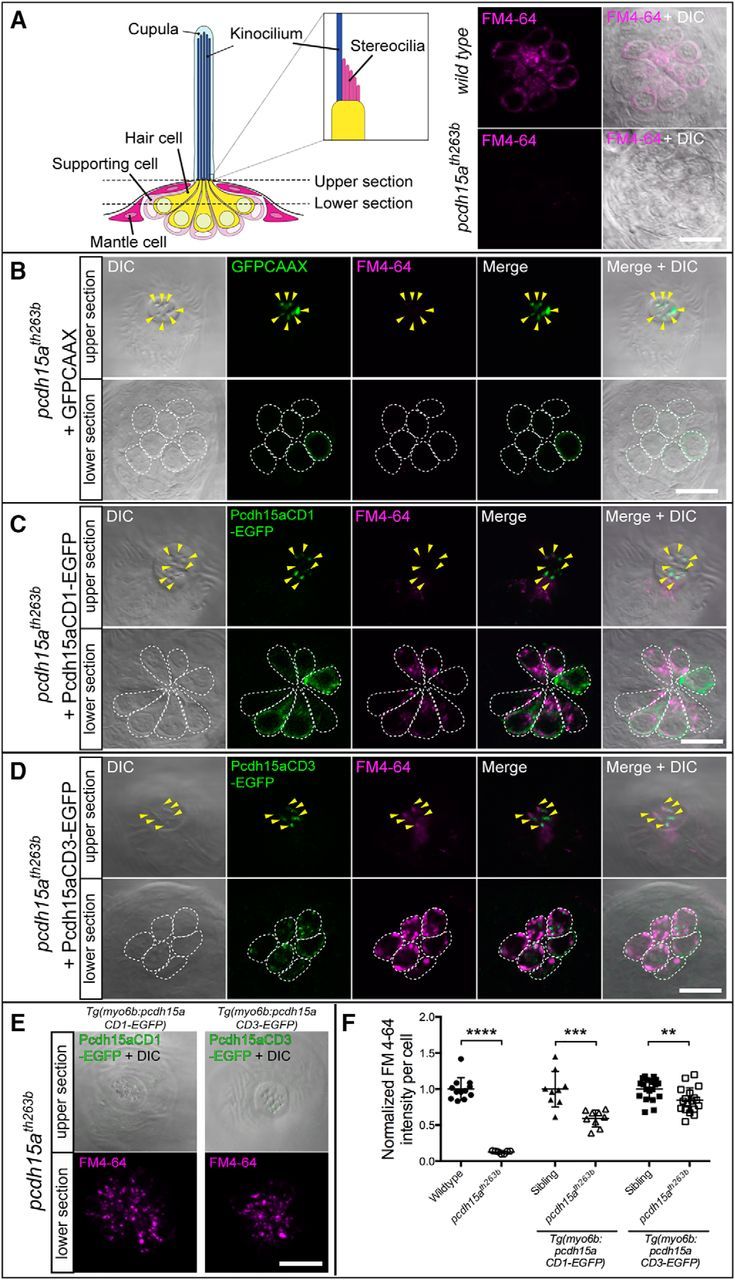
Rescue of defective FM4-64 labeling of pcdh15ath263b mutant hair cells by either isoform of Pcdh15a. A, Left, Diagram indicating focal planes of neuromast hair cells used for imaging of the GFP signal and FM4-64 label in wild-type and pcdh15ath263b larvae. Top and bottom sections in B–D show hair bundles and cell bodies, respectively. A, Right, FM4-64 labeling in wild-type (top) and pcdh15ath263b mutant hair cells (bottom), 4 dpf. B–D, Representative images of the FM4-64 label in neuromasts of 4 dpf pcdh15ath263b larvae with transient expression of GFPCAAX (B), pcdh15a-CD1-EGFP (C), or pcdh15a-CD3-EGFP (D). Arrowheads indicate EGFP-positive hair bundles. Somas of individual hair cells are outlined by white dotted lines. E, Representative images of rescued mutant hair cells in CD1 and CD3 stable transgenic lines, 6 dpf. The bottom section is a maximum projection of seven sections (the same as those used in F for quantification). F, Quantification of the intensity of FM4-64 labeling of EGFP-positive hair cells in stable transgenic lines. The values of the nontransgenic and transgenic homozygous mutants are normalized to the mean value of their corresponding wild-type siblings. For each transgenic construct, n ≥ 9 neuromasts from a minimum of three larvae. Nontransgenic mutants (n = 7) and their wild-type siblings (n = 12) are from the pcdh15a-CD3-EGFP line. The mean and SD are indicated; p-values were determined by unpaired Student's t tests (two-tailed, Welch-corrected), **p < 0.01; ***p < 0.001; ****p < 0.0001. Scale bars in A–E, 10 μm.
