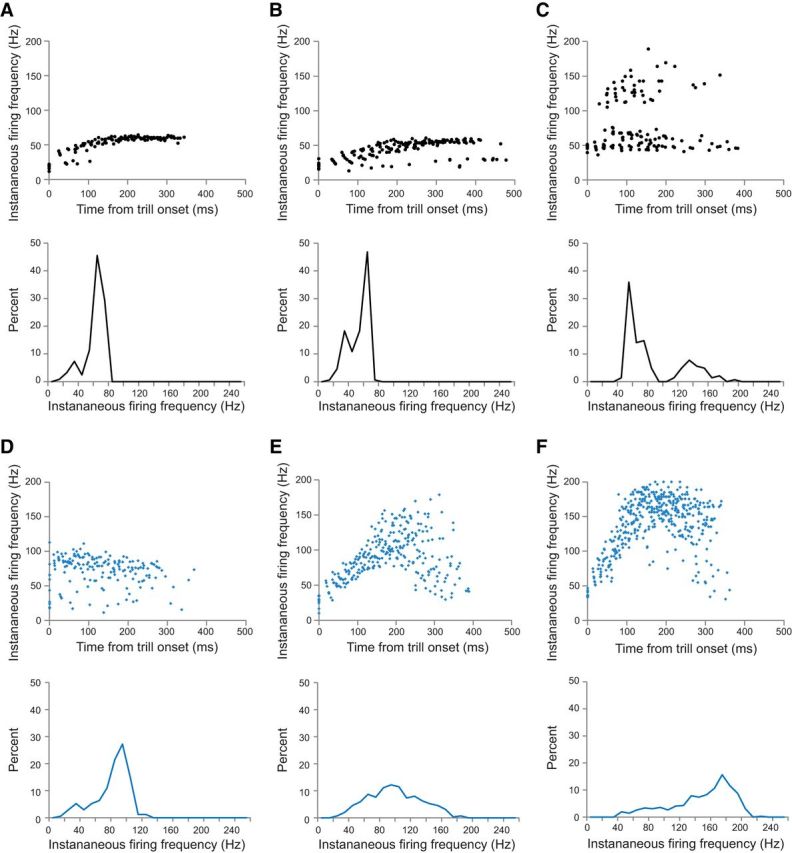
Figure 3.

Spike rate variability within and across individual premotor neurons in intact versus transected brains. A–C, Scatterplots of spike frequency versus time for three individual premotor FTNs in intact control brains (top) with corresponding spike rate histograms (bottom). Spike rates increase at the beginning of each trill, with the majority of spikes occurring in the fast trill range of 50–60 Hz. Some cells (as in C) also exhibit a higher band of spike rates due to doublet or triplet spikes occurring with some nerve CAPs. Other cells have sporadic low spike rates due to spike failures (as in B). Corresponding spike rate histograms show a major narrow peak in the range of fast trill rates. D–F, Scatterplots of spike frequency versus time for three individual premotor FTNs recorded in transected brains (top) with corresponding spike rate histograms (bottom). The majority of FTN spikes in transected brains are produced at rates much faster than the normal range. Some cells maintain a fairly narrow band of spike frequencies (as in D), albeit at higher than normal rates; other cells initially spike near fast trill rates but then accelerate to faster and broader frequency bands (E, F). Corresponding spike rate histograms show peaks that are faster and broader than those seen in recordings from intact brains.
