Figure 5.

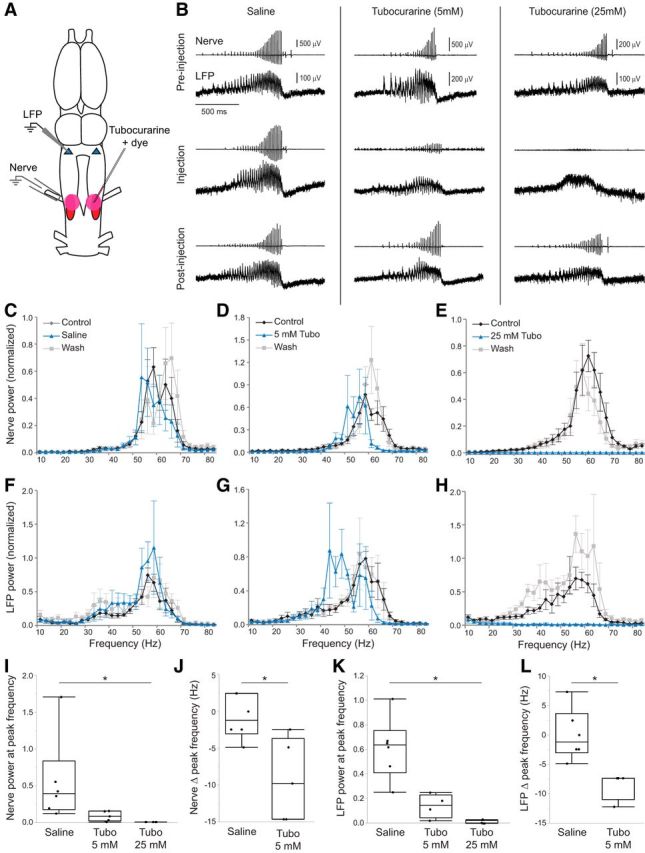
Blocking nAChRs in the motor nucleus disrupts premotor activity. A, The nAChR blocker tubocurarine or saline was pressure injected bilaterally into n.IX-X while recording the laryngeal nerve and DTAM LFP. Pink circles represent injection site. B, Simultaneous nerve and LFP recordings for saline controls, 5 mm tubocurarine, and 25 mm tubocurarine preinjection (top), immediately following injection (middle), and after washout (bottom). Saline controls produced normal fictive song and DTAM activity, but tubocurarine disrupted CPG function in a dose-dependent manner. C–E, Power spectra of nerve recordings for saline (C), 5 mm tubocurarine (Tubo) (D), and 25 mm tubocurarine (E) injections (n = 6, n = 5, and n = 5 brains, respectively). F–H, Power spectrum of LFP for saline (F), 5 mm tubocurarine (G), and 25 mm tubocurarine (H) injections (n = 6, n = 4, and n = 4 brains, respectively). Values are mean ± SEM for all graphs. I, Effect of tubocurarine injections on nerve power at control peak frequencies relative to saline controls (n = 6, n = 5, and n = 5 brains, respectively). *p = 0.0012. J, Nerve power spectra show a decrease in peak frequency after 5 mm tubocurarine injection compared with saline controls (n = 5 and n = 6 brains, respectively). K, Effect of tubocurarine injections on LFP power at control peak frequencies relative to saline controls (n = 6, n = 4, and n = 4 brains, respectively). *p = 0.0035. L, LFP power spectra show a decrease in peak frequency after 5 mm tubocurarine injections compared with saline controls (n = 4 and n = 6 brains, respectively). *p = 0.0048. Each box plot represents individual data points, median, minimum, maximum, and interquartile range.
