
Figure 9.
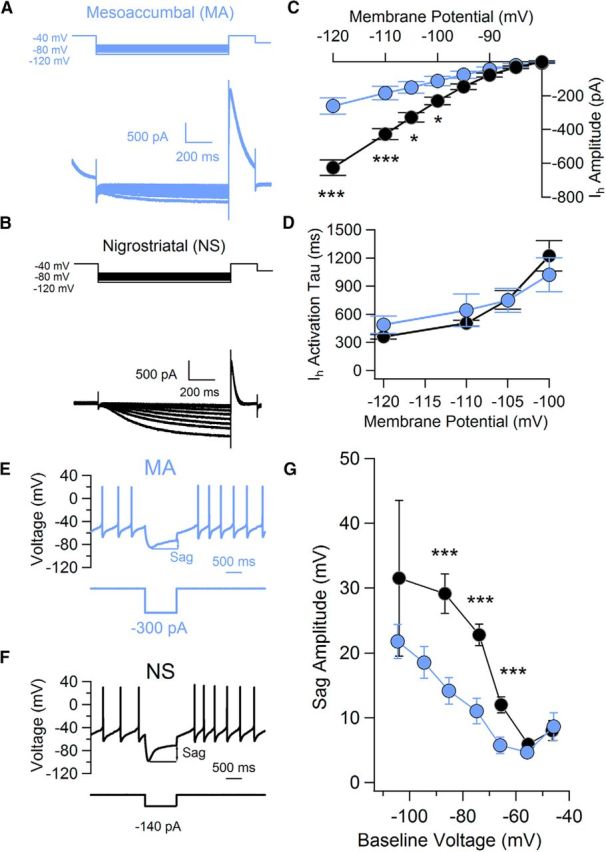
Biophysical properties of H-current in mesoaccumbal and nigrostriatal subpopulations. A, B, Voltage protocols (top) and representative family of hyperpolarization-activated currents (IH; bottom) evoked by a range of steps from −120 to −80 mV, recorded in a mesoaccumbal (A) and nigrostriatal (B) dopamine neurons. C, Summary current–voltage relationship plots for H currents recorded from mesoaccumbal (light blue) and nigrostriatal (black) dopamine subpopulations. D, Summary of time constant of activation for H currents measured in mesoaccumbal and nigrostriatal dopamine subpopulations. Time constant of activation values were obtained by fitting an exponential to the raw current traces of H currents. E, F, Example traces displaying depolarizing sag potentials in response to hyperpolarizing current injections in mesoaccumbal (E) and nigrostriatal (F) neurons. Sag potentials were measured as the difference between the peak minimum and baseline voltages. G, Summary plot of sag amplitudes measured in mesoaccumbal and nigrostriatal dopamine neurons. ***, P < 0.05.