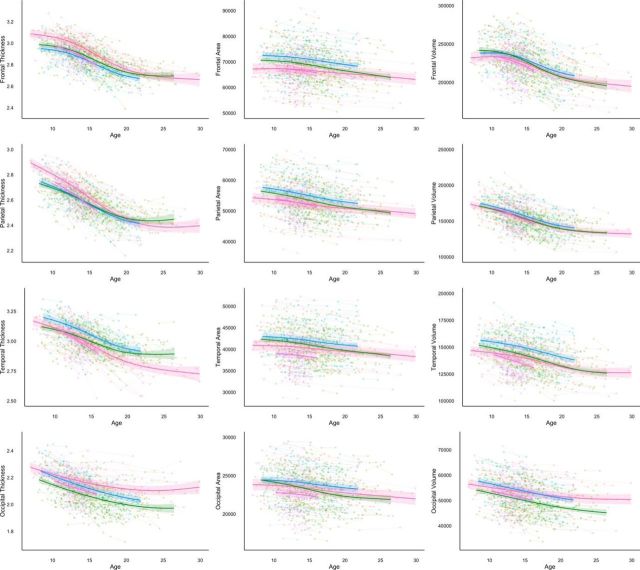
Figure 2.
Developmental trajectories for lobar cortical measures. Spaghetti plots of lobar cortical thickness, surface area, and volume, controlling for sex. The colored lines represent the GAMM fitting while the lighter colored areas correspond to the 95% confidence intervals. Pink, CPB; Purple, PIT; blue, NCD; green, BT.

