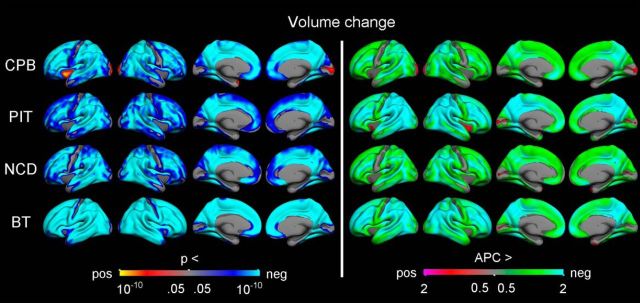
Figure 3.
Longitudinal change in cortical volume. GLMs were used to test the statistical significance of APC in volume across the brain surface in each sample, with sex and mean age included as covariates. The results were corrected for multiple comparisons using cluster-size inference. Left, Uncorrected p values within the corrected significant clusters. Right, Rates of change.

