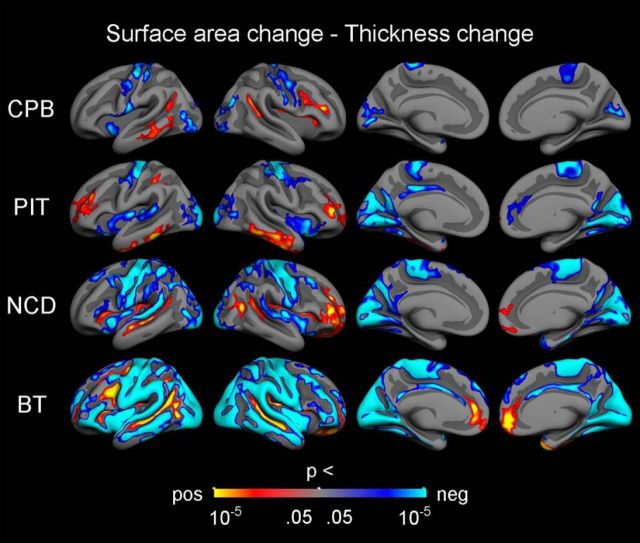
Figure 7.
Relationships between change in surface area and change in thickness. Vertex-wise p value maps from GLMs testing the relationships between symmetrized APC in different cortical measures, with sex and mean age included as covariates. The results were corrected for multiple comparisons using cluster-size inference. Uncorrected p values within the corrected significant clusters are shown. Red–yellow reflects a positive relationship, where a relatively large decrease in one measure is associated with a relatively large decrease in the other measure. Blue–cyan reflects a negative relationship, in which a relatively large decrease on one measure is associated with a relatively small decrease or increase on the other measure.

