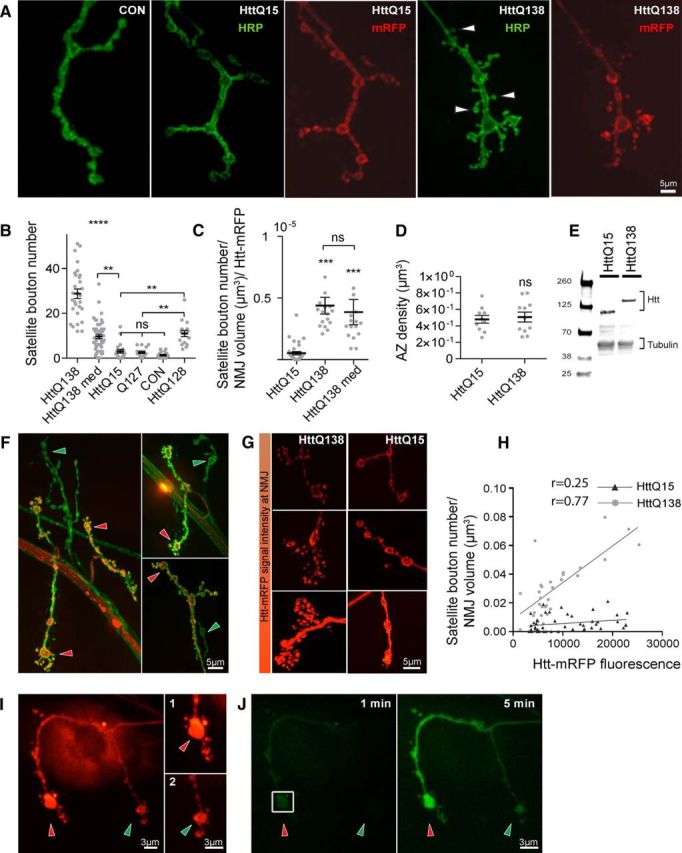
Figure 1.

Expression of pathogenic HttQ138 induces overgrowth of NMJ synapses. A, Representative images of third instar NMJ 4 in control (ElavC155), ElavC155;UAS-HttQ15-mRFP and ElavC155;UAS-HttQ138-mRFP larvae stained with anti-HRP to label neuronal membranes. HttQ138 expression results in a robust overgrowth of smaller satellite boutons (arrowheads). B, Quantification of satellite bouton number at NMJ 4 in ElavC155;UAS-HttQ138-mRFP high expression, ElavC155;UAS-HttQ138-mRFP medium expression, ElavC155;UAS-HttQ15-mRFP, ElavC155;UAS-Q127, control (ElavC155), and ElavC155;UAS-HttQ128. C, Level of synaptic overgrowth induced by HttQ138, HttQ138med, and HttQ15 normalized by NMJ volume and Htt-RFP intensity. D, Expression of HttQ138 does not alter AZ density compared with HttQ15. E, Western blot data showing similar Htt expression levels in HttQ138 and HttQ15 larval extracts. F, NMJ 4 axon terminals expressing HttQ138-mRFP (red) stained with anti-HRP (green). HttQ138 accumulates stochastically in different nerve branches, resulting in synaptic overgrowth in those areas where HttQ138 has accumulated (red arrows). Branches lacking HttQ138 display more normal morphology (green arrows). G, Different levels of HttQ138 and HttQ15 accumulation (red) can be observed at distinct muscle 4 NMJs, resulting in increasing severity of synaptic overgrowth. H, Correlation between HttQ138 and HttQ15 expression at NMJ 4 synapses with the severity of satellite bouton overgrowth. I, Differential accumulation of HttQ138 can be seen at different branches of the same axon. The branch with more Htt expression (I1, red arrow) shows a more robust synaptic overgrowth phenotype compared with the branch with less HttQ138 accumulation (I2, green arrow). J, Diffusion of PA-GFP after photoactivation of the squared region of the NMJ shown in H. PA-GFP diffuses from the branch with more HttQ138 (red arrow) to the branch with lower HttQ138 accumulation, confirming that the branches arise from the same axon. Images were taken 1 min (left) and 5 min (right) after photoactivation. ANOVA followed by Tukey's multiple-comparisons tests was used for statistical analysis. *p ≤ 0.05; **p ≤ 0.01; ***p ≤ 0.001. Error bars indicate SEM.
