Figure 7.

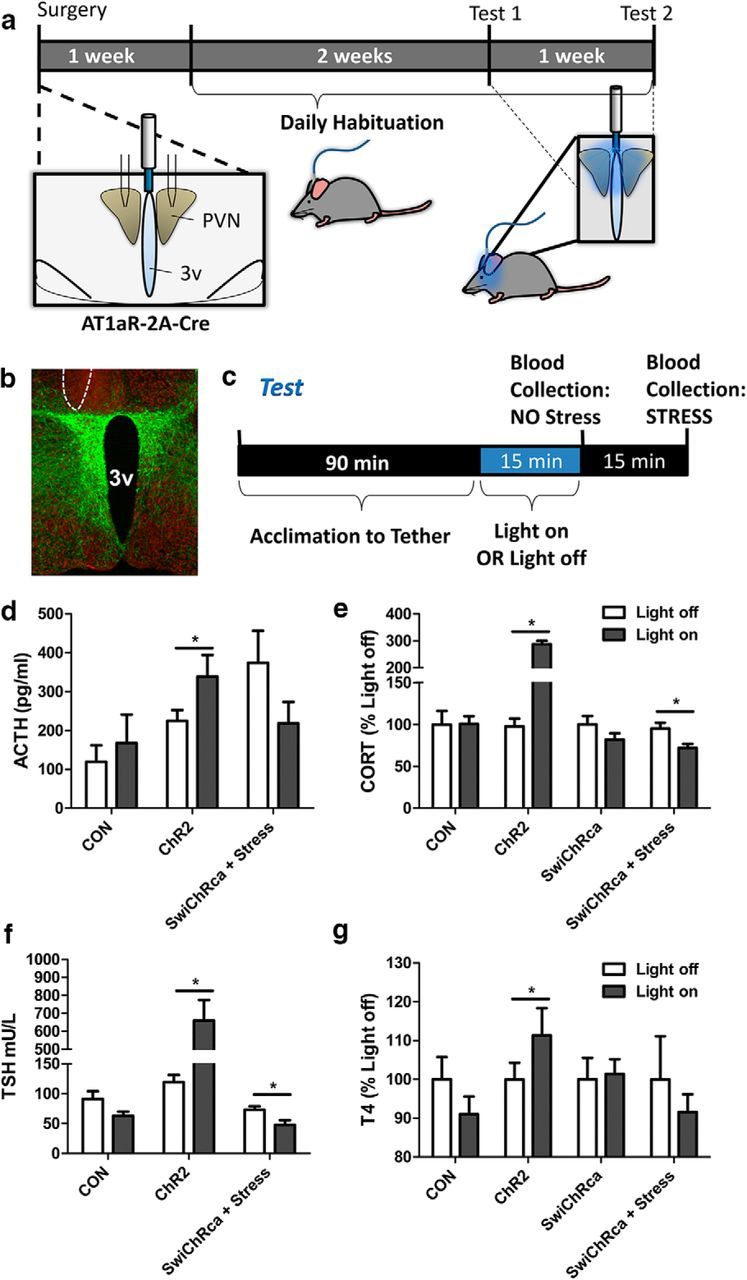
Impact of in vivo optogenetic stimulation/inhibition of PVN AT1aR neurons on the HPA and HPT axes. a, Schematic of the experimental protocols used for the evaluation of the impact of optogenetic stimulation/inhibition on the activity of the HPA and HPT axes. Stereotaxic surgery for the injection of the AAVs described in Figure 6a bilaterally into the PVN and unilateral implantation of the fiber optic post was followed by a period of recovery and habituation to the tethering protocol, and then by the test protocol. b, Image of a representative hit used for these studies with eYFP in green and the neuronal marker HuC/D in red; the unilateral site of post implantation is outlined by a dashed line. c, The test protocol used to generate the neuroendocrine data. The blue-light stimulation/inhibition parameters are as follows: the AAV-ChR2-eYFP and the AAV-eYFP mice were subjected to 20 ms pulses, 15 Hz, 5 s on followed by 5 s off; the AAV-SwiChR2 mice received 500 ms pulses at 0.033 Hz; in all cases, the stimulation/inhibition protocols continued for 15 min. d–g, Stimulation/inhibition of AT1aR neurons using this protocol led to alterations in the circulating levels of (d) ACTH, (e) CORT, (f) TSH, and (g) T4. 3v, Third cerebral ventricle. Error bars indicate SEM. *p < 0.05.
