Figure 4.
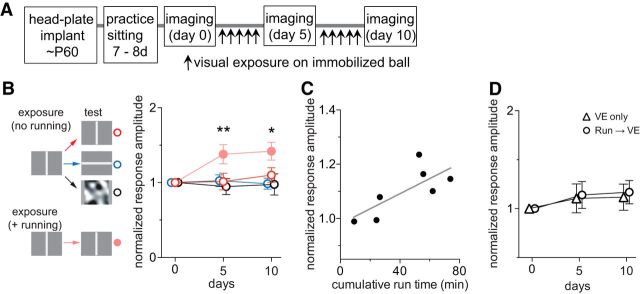
Restricting locomotion reduces stimulus-specific enhancement of response magnitude. A, Experimental schedule. B, Changes in response magnitudes in animals that viewed drifting vertical bars daily while on the Styrofoam ball, the movement of which was restricted. Intrinsic signal imaging was performed in each animal to measure cortical responses to three different visual stimuli, vertical bars (red), horizontal bars (blue), and contrast-modulated noise (black). The right panel shows change in response amplitude in animals that moved freely on the ball while viewing drifting vertical bars, shown in solid pink circles (data from Fig. 1C). Response amplitudes were normalized to baseline (day 0) and are shown as mean ± SD. *p < 0.05; **p < 0.01 between the free run group and restricted move group (two-way ANOVA followed by multiple comparisons with Bonferroni's correction). C, Change in response amplitude as a function of total duration of movement in animals that were placed on balls with restricted movement. Each point shows data from individual animals in B. The y-axis represents normalized responses to drifting vertical bars (the exposed visual stimulus) at day 10. The x-axis represents 10 day cumulative duration that the trackball was considered moving (>1 cm/s; R2 = 0.58; slope, 0.0029 ± 0.0011; 95% CIs, 4.39e−0.005, 0.0057; slope deviation from zero, p = 0.047; least-squares linear regression). D, Visual experience while not engaging in running did not enhance V1 responses. One group of animals was allowed to run freely on a floating Styrofoam ball while viewing a blank gray screen for 1 h daily, followed immediately by being returned to home cage and exposed to a drifting vertical bar for 1 h, on day 1 through day 10 (run → VE; n = 4). Another group of mice was exposed to the same visual stimulus in the home cage without preceding running (VE only; n = 4). Visual exposure was done while the animals were placed in the housing cage, which was made of clear polycarbonate and surrounded by four monitors, one on each side, displaying the visual stimulus. Responses to the experienced stimulus (vertical bar) were recorded on day 0 (baseline), day 5, and day10. Data are normalized to the baseline value and presented as mean ± SD. Response magnitude on day 5 or day 10 was not significantly different from baseline in either group (two-way ANOVA).

