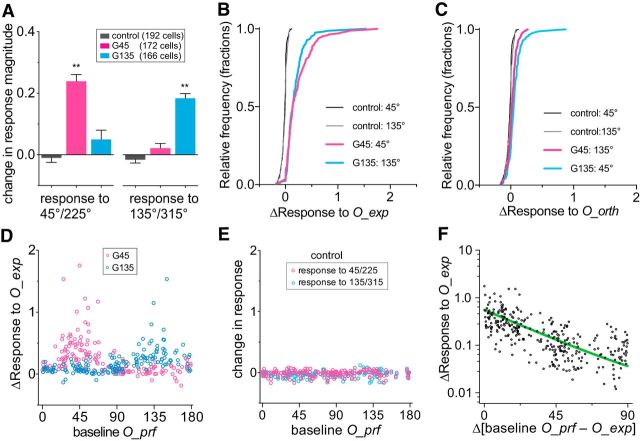
Figure 6.
Changes in calcium response magnitudes after running plus visual exposure. A, Changes in calcium signals in response to gratings of the exposed orientation and the orthogonal orientation. Bars represent mean ± SEM. **p < 0.001, compared with the respective control group (one-way ANOVA followed by multiple comparisons with Bonferroni's correction). B, C, Cumulative frequency distributions of changes in response magnitude to the exposed orientation during running (O_exp; B) and the orientation orthogonal to O_exp (O_orth, C). D, Change in responses to orientations that were exposed during locomotion (O_exp), plotted against each cell's baseline preferred orientation. Each circle represents simple difference in response magnitudes between postexposure and baseline in a single cell. E, Differences in responses to gratings at 45°/225° and 135°/315° between the first (baseline) and the second (postsession) recordings plotted against each cell's baseline O_prf in the control group. Each circle represents the simple difference in response magnitudes between postsession and baseline in a single cell. F, Changes in responses to O_exp, shown in D, were replotted to the distance of each cell's baseline O_prf from O_exp. Data from two experimental groups were pooled. The green line represents one phase decay fit (R2 = 0.399).

