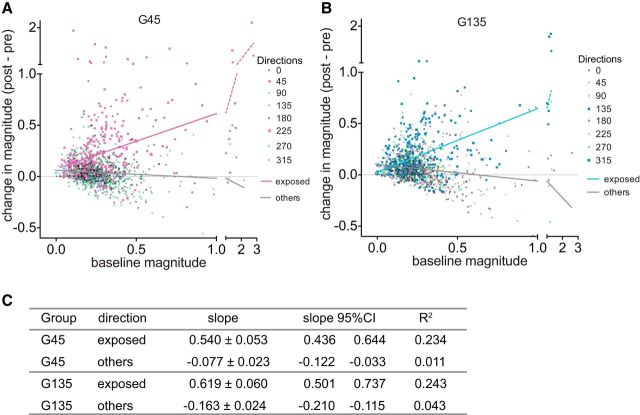
Figure 7.
Relationship between baseline Ca2+ responses and change in response magnitudes at each direction of drifting grating stimuli. A, B, Data from each experimental group were plotted separately (A, G45 group; B, G135 group). Lines represent least squares linear regression, analyzed for the exposed two directions and other six directions separately. C, Statistical data for linear regression. All slopes showed statistically significant deviation from zero (p < 0.0001).

