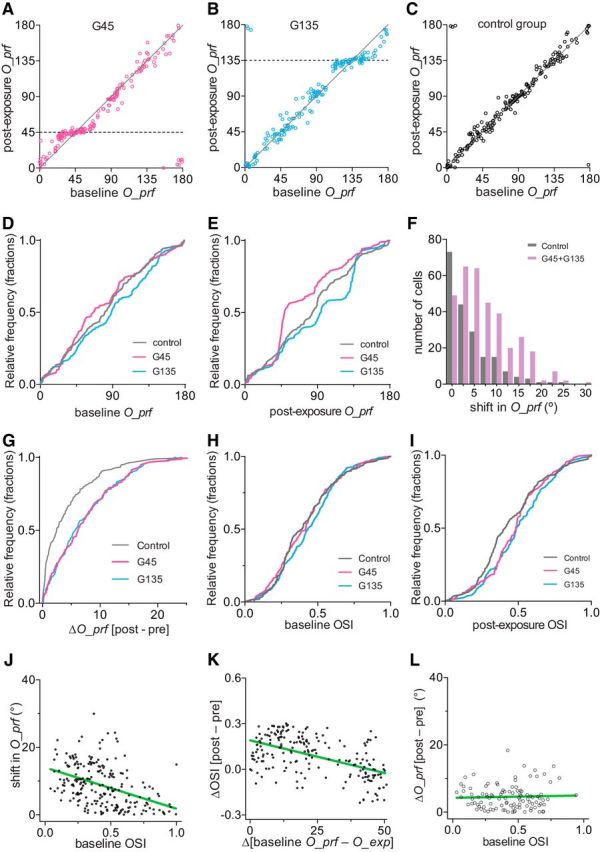
Figure 8.

Changes in preferred orientation and orientation selectivity after running plus visual exposure. A–C, Preferred orientation in individual cells at baseline (x-axis) and after exposure (y-axis) in the G45 (A), G135 (B), and control (C) groups. D, Cumulative frequency distribution of preferred orientations at baseline. E, Cumulative frequency distribution of O_prf after exposure to specific orientations of drifting gratings during daily running. F, Frequency distributions of shift in O_prf, summarized from data shown in A–C. Data from two experimental groups were pooled. p < 0.001 between control and experimental groups (Kolmogorov–Smirnov test). G, Cumulative frequency distribution of shift in O_prf in individual cells. H, Cumulative frequency distribution of orientation selectivity at baseline. I, Cumulative frequency distribution of OSI after the exposure to specific orientations of drifting gratings during daily running. J, Inverse correlation between baseline OSI and shift in O_prf in experimental groups. The green line represents linear regression (R2 = 0.18; slope, −12.21 ± 1.78; 95% CIs, −15.71, −8.72; slope deviation from zero, p < 0.0001). K, Increase in orientation selectivity when the cells' baseline O_prf was closer to O_exp. The green line represents linear regression (R2 = 0.28; slope, −0.0043 ± 0.0005; 95% CIs, −0.0053, −0.0033; slope deviation from zero, p < 0.0001). L, Shift in O_prf had no relationship to baseline OSI in cells in which baseline O_prf were >50° apart from the exposed orientations (R2 = 0.0015; slope, 0.703 ± 1.807; 95% CIs, −2.89, 4.29; slope deviation from zero, p = 0.698, least-squares linear regression). For analyses in J and K, we selected cells in which baseline O_prf was within 50° from O_exp and pooled G45 and G135 (n = 199).
