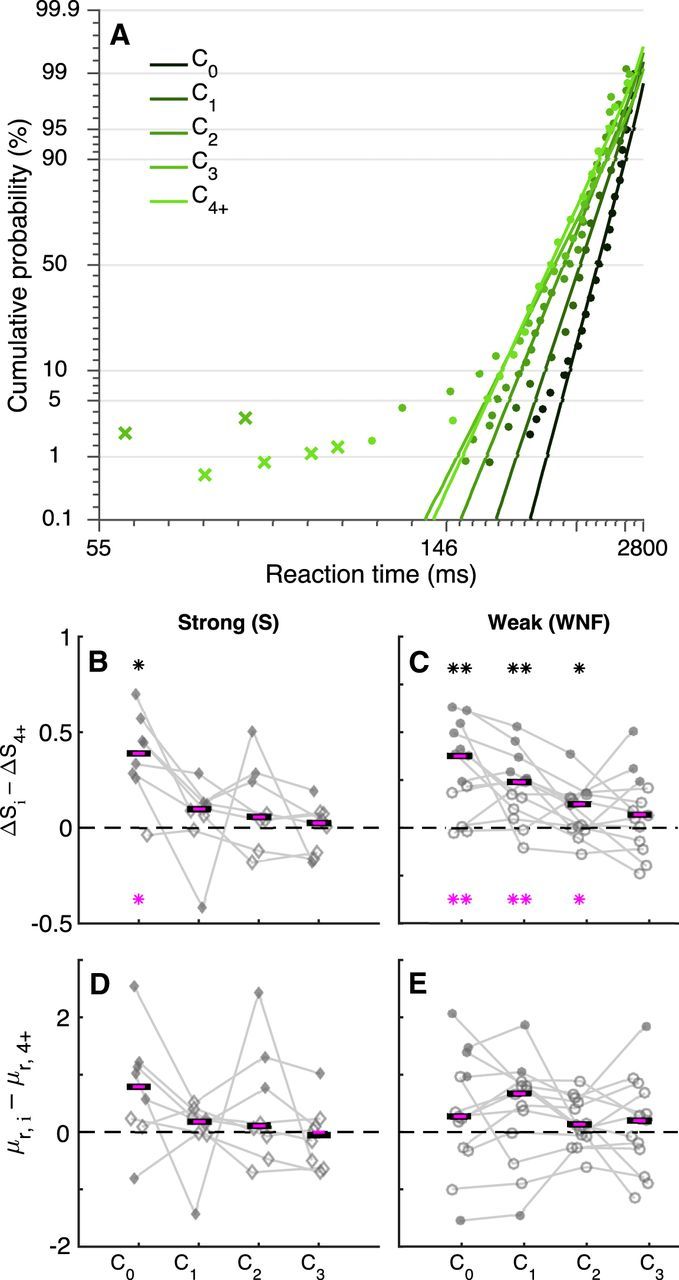
Figure 3.

Saccadic priors reflect the accumulation of weak evidence over trials for individual subjects. A, Example saccadic RT distributions from a single subject (points) plotted on a reciprobit scale for weak stimuli with feedback. Data are separated by color, as indicated, based on the trial number after a change point: C0 is a choice on a change point (switch) trial and Ci is a choice on the ith trial after a change point (stay). Lines are fits of the LATER model, computed separately for each condition, to regular saccades (circles) but not short-latency saccades (crosses). B–E, Best-fitting values of ΔS (B, C) or μr (D, E) from the basic LATER model, fit to correct trials only, standardized to their steady-state values (computed from 4+ trials after a change point). These values are plotted as a function of trials 0–3 after a change point (indicated on the abscissa) computed per subject (connected points). B, D, Strong stimuli (n = 8 subjects). C, E, Weak stimuli with no feedback (n = 13 subjects). Filled points indicate that the given value is significantly nonzero (likelihood-ratio test, p < 0.01). Black lines indicate across-subject medians per task condition; asterisks indicate whether the median deviates significantly from zero (i.e., with respect to their steady-state, prechange point values; two-sided Wilcoxon rank-sum test, *p < 0.05; **p < 0.01; ***p < 0.001). Magenta lines (and asterisks) indicate medians of best-fitting values from the corresponding parameters (corresponding to correct choices) of the model with dual accumulators, which was fit to both correct and error choices. In all cases, HLR = HRL = 0.2 or 0.25.
