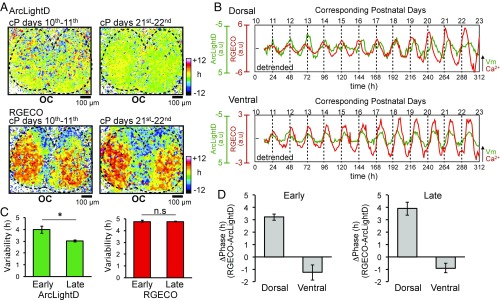
Fig. 6.
Long-term recording of the voltage and Ca2+ rhythms. (A) Acrophase maps of the voltage rhythm (Upper) and Ca2+ rhythm (Lower) at the early stage (days cP10–cP11) (Left) and the late stage (days cP21–cP22) (Right) of long-term recording. The mean acrophase of the entire SCN regions was separately normalized to zero for voltage and Ca2+ rhythms. (B) Time course of the voltage rhythms (green traces) and Ca2+ rhythms (red traces) in the dorsal (Upper) and ventral (Lower) regions during 13 d of recording. (C) Network synchronization of the voltage (Left) and Ca2+ (Right) rhythms at the early and late stages of the recordings. The variability of network synchrony is represented by the acrophase SD. (D) Phase difference (ΔPhase) between voltage and Ca2+ rhythms in the dorsal and ventral SCN at the early (Left) and late (Right) stages of the recording (n = 5). *P < 0.05. Data are given as the mean ± SEM.

