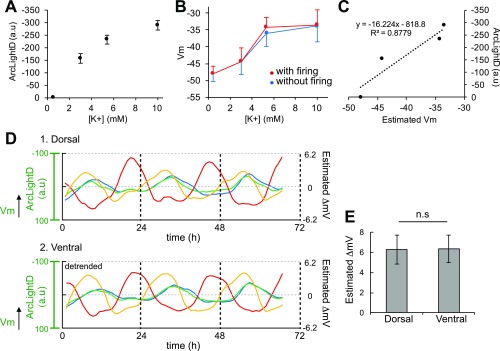
Fig. S3.
ArcLightD reports a change in membrane potentials. (A) ArcLightD fluorescence changes in the SCN slices under various extracellular KCl concentrations (0.5, 3.5, 5.4, 10 mM); n = 6 slices. (B) Mean membrane potentials (Vm) with (red) and without (blue) neuronal firings in various extracellular KCl concentrations (23 neurons in six slices). (C) Estimated changes in ArcLightD fluorescence plotted against the estimated Vm. (D) The voltage rhythms are shown in fluorescence (left ordinate) and in estimated ΔmV (right ordinate) in the dorsal and ventral SCN regions (100 × 100 μm). Each color trace represents a different slice (n = 4). (E) The estimated amplitude expressed in ΔmV in the dorsal and ventral SCN regions. Note that all data in this figure were taken with same experimental settings (i.e., exposure time, excitation light intensity, EM gain) using an iXon EM-CCD camera (Andor). n.s., statistically not significant.

