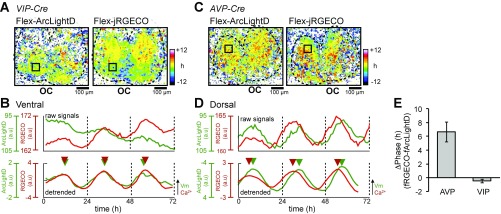
Fig. S4.
The voltage and Ca2+ rhythms in VIP and AVP neurons. Using two Flex-AAVs, both ArcLightD and jRGECO are expressed only in the VIP neurons (A and B) or AVP neurons (C and D). (A) Acrophase maps of the voltage rhythms (Left) and Ca2+ rhythms (Right) in the VIP neurons. The mean acrophase of the entire SCN regions is separately normalized to zero for voltage and Ca2+ rhythms. (B) Raw (Upper) and 24-h detrended (Lower) traces of the voltage rhythms (green traces) and Ca2+ rhythms (red traces). Triangles indicate the peak phase of each rhythm. (C) Acrophase maps of the voltage rhythms (Left) and Ca2+ rhythms (Right) in the AVP neurons. (D) Raw (Upper) and 24-h detrended (Lower) traces of the voltage rhythms (green traces) and Ca2+ rhythms (red traces). Traces were taken from the square ROIs in C. (E) Phase difference (ΔPhase) between voltage and Ca2+ rhythms in the AVP (n = 4) and VIP (n = 3) neurons. OC, optic chiasm. Data are given as the mean ± SEM.

