Fig. 1.
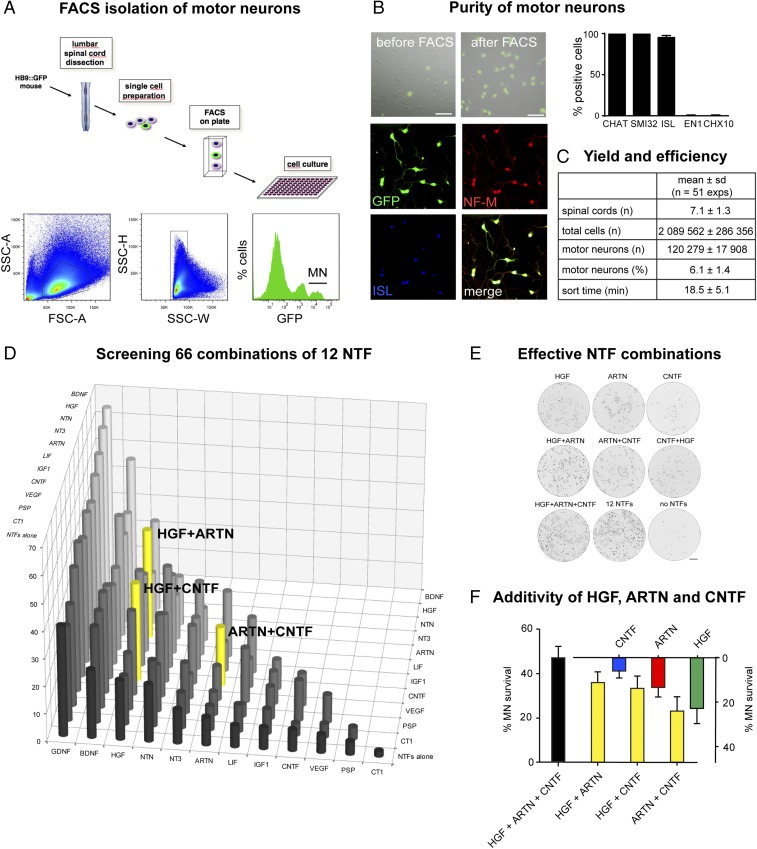
Screening neurotrophic factor combinations on FACS-isolated motor neurons. (A) FACS diagram (Upper) depicts FACS-isolation and culture of motor neurons from embryonic E12 Hb9:GFP mice. FACS profiles (Lower) show sequential gating of cells through forward-scatter area (FSC-A)/side scatter area (SSC-A), side scatter width (SSC-W)/side scatter height (SSC-H), and GFP fluorescence to isolate motor neurons (MN) (Right) from bulk cells (Left) and interneurons (Center). (B) Purity of FACS-isolated motor neurons. GFP/DIC images (Top) show cells before and after FACS. 20× objective. (Scale bar: 50 µm.) Immunofluorescence images (Middle and Bottom) show FACS-isolated motor neurons positive for GFP, neurofilament-M (NF-M), and ISL1/2. The diagram indicates that FACS-isolated cells are positive for motor neuron markers CHAT, SMI32, and ISL1/2 but negative for interneuron markers EN1 and CHX10 (mean ± SD, n = 4 replicates). (C) Yield and efficiency of FACS-based MN isolation. (D) Testing 66 NTF combinations on motor neuron survival reveals potentiated effects of pairwise combinations among HGF, ARTN, and CNTF. P < 0.0001 (HGF + CNTF, HGF + ARTN) and P < 0.04 (ARTN + CNTF) by Kruskal–Wallis test and Dunn’s post hoc test, n = 12 wells each, compared with the individual NTFs. Motor neuron survival at 3 DIV is expressed relative to the values for 12 NTFs (100%) and no NTF (0%). (E) Whole-well images showing motor neurons cultured for 3 DIV in the presence of the indicated NTFs. (F) Diagram showing strictly additive survival effects of HGF, ARTN, and CNTF in pairwise and triple combination (mean ± SD). Statistical significance was tested by Kruskal–Wallis test and Dunn’s post hoc test.

