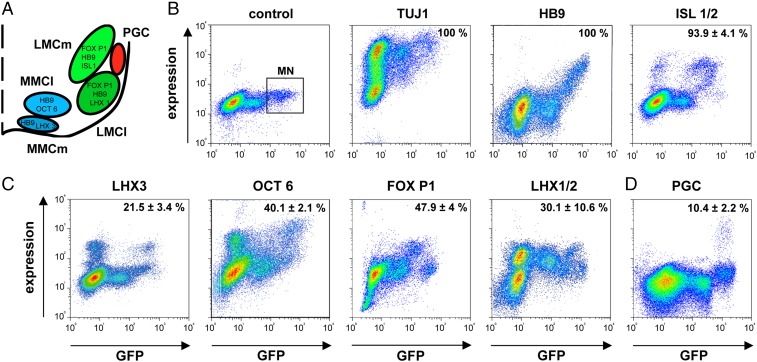
Fig. 2.
Quantitation of motor neuron subsets by double-color flow cytometry. (A) Schematic depicting position and molecular markers of motor neuron subsets in mouse E12 lumbar spinal cord. (B) Density plots indicating the percentage of neurons (TUJ1) and motor neurons (HB9, ISL1/2) in lumbar ventral spinal cord of HB9:GFP mice analyzed by double-color flow cytometry. A representative control (Left) showing labeling with isotype-matched primary antibody and indicating the motor neuron population (MN). (C) Density plots indicating the percentage of MMC motor neurons (LHX3, OCT6) and LMC motor neurons (FOXP1, LHX1/2) among motor neurons. Note overlap of some markers in motor neuron subsets and expression of LHX3, OCT6, and LHX1/2 in subsets of interneurons. (D) Density plot indicating percentage of preganglionic (PGC) neurons after bulk retrograde labeling with tetramethylrhodamine-dextran from bladder. Percentages represent means ± SD of 3–4 independent experiments.

