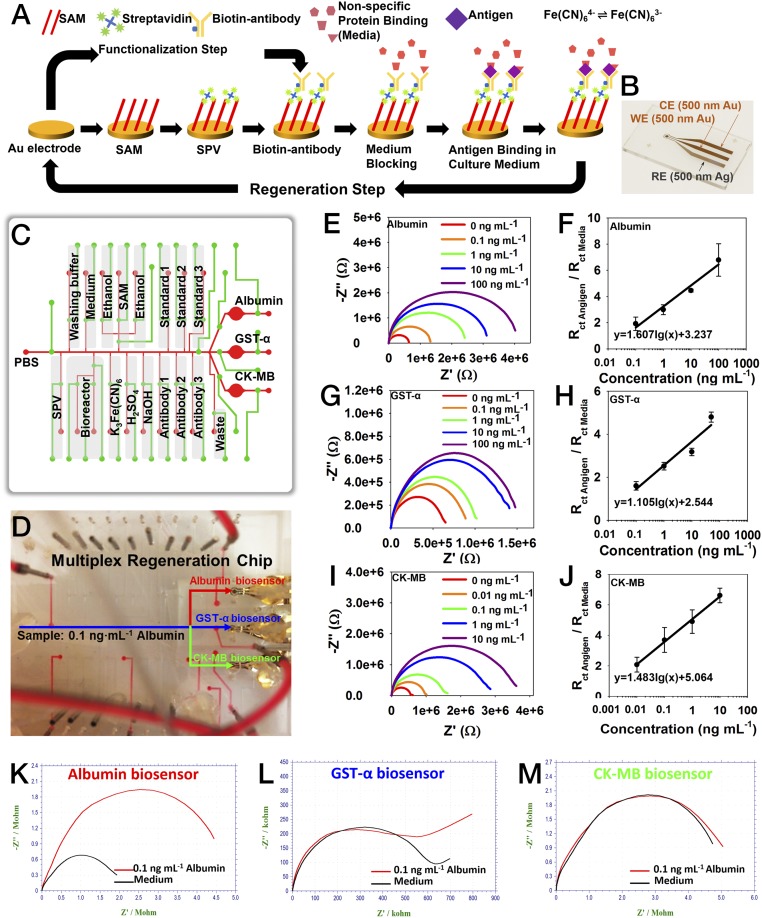
Fig. 3.
Integration of microfluidic electrochemical and physical sensors. (A) Schematic diagram showing the functionalization and regeneration process of the electrode for measurement of soluble antigens. (B) Photograph showing a fabricated microelectrode set containing an Au WE, an Au CE, and an Ag RE. (C) Schematic showing the design of the multiplexed microfluidic chip for precisely timed injections of the chemicals for electrochemical detection. (D) Photograph of automated multiplexed regeneration microfluidic chip. (E and F) EIS plot of the calibration impedance measurements obtained from 0 to 100 ng⋅mL−1 albumin and the corresponding calibration curve for albumin. (G and H) EIS plot of the calibration impedance measurements obtained from 0 to 100 ng⋅mL−1 GST-α and the corresponding calibration curve for GST-α. (I and J) EIS plot of the calibration impedance measurements obtained from 0 to 100 ng⋅mL−1 CK-MB and the corresponding calibration curve for CK-MB. Three measurements on three individual electrodes were used to plot each data point on each calibration curve. (K) The response of albumin biosensor to albumin (0.1 ng⋅mL−1). (L) The response of albumin biosensor to GST-α (0.1 ng⋅mL−1). (M) The response of albumin biosensor to CK-MB (0.1 ng⋅mL−1).

