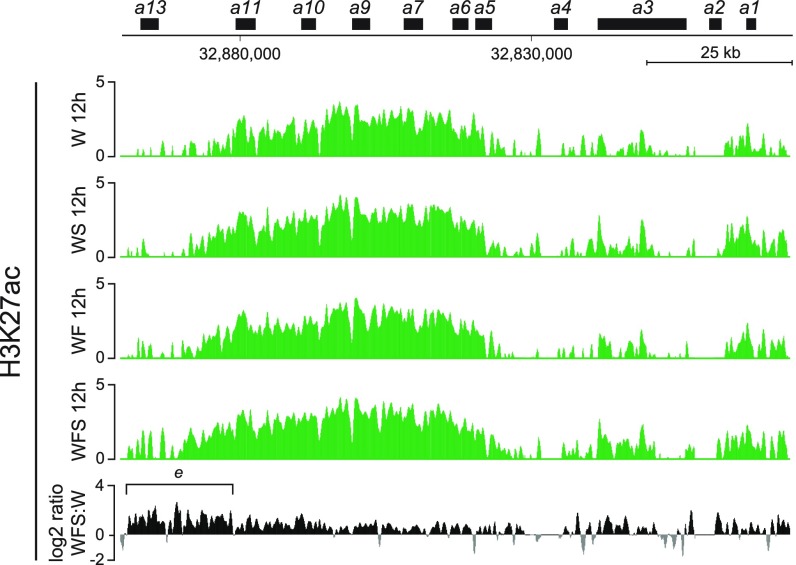
Fig. S3.
H3K27ac ChIP-seq on the HoxA cluster. Shown are the H3K27ac ChIP-seq profiles covering the HoxA gene cluster in cultured limb progenitor cells treated either with Shh (WS), Fgf8 (WF), or Fgf8 and Shh (WFS). The latter condition induced a robust activation from the Hoxa11 to the Hoxa13 genes. Enrichment (y axis) is shown as the log2 ratio of the normalized number of reads between ChIP and input samples, except for each fifth track. The log2 ratio of the normalized number of reads between H3K27ac of Fgf8 and Shh-treated cells and control cells (only Wnt3a) is shown by positive (black) and negative (gray) values, respectively.

