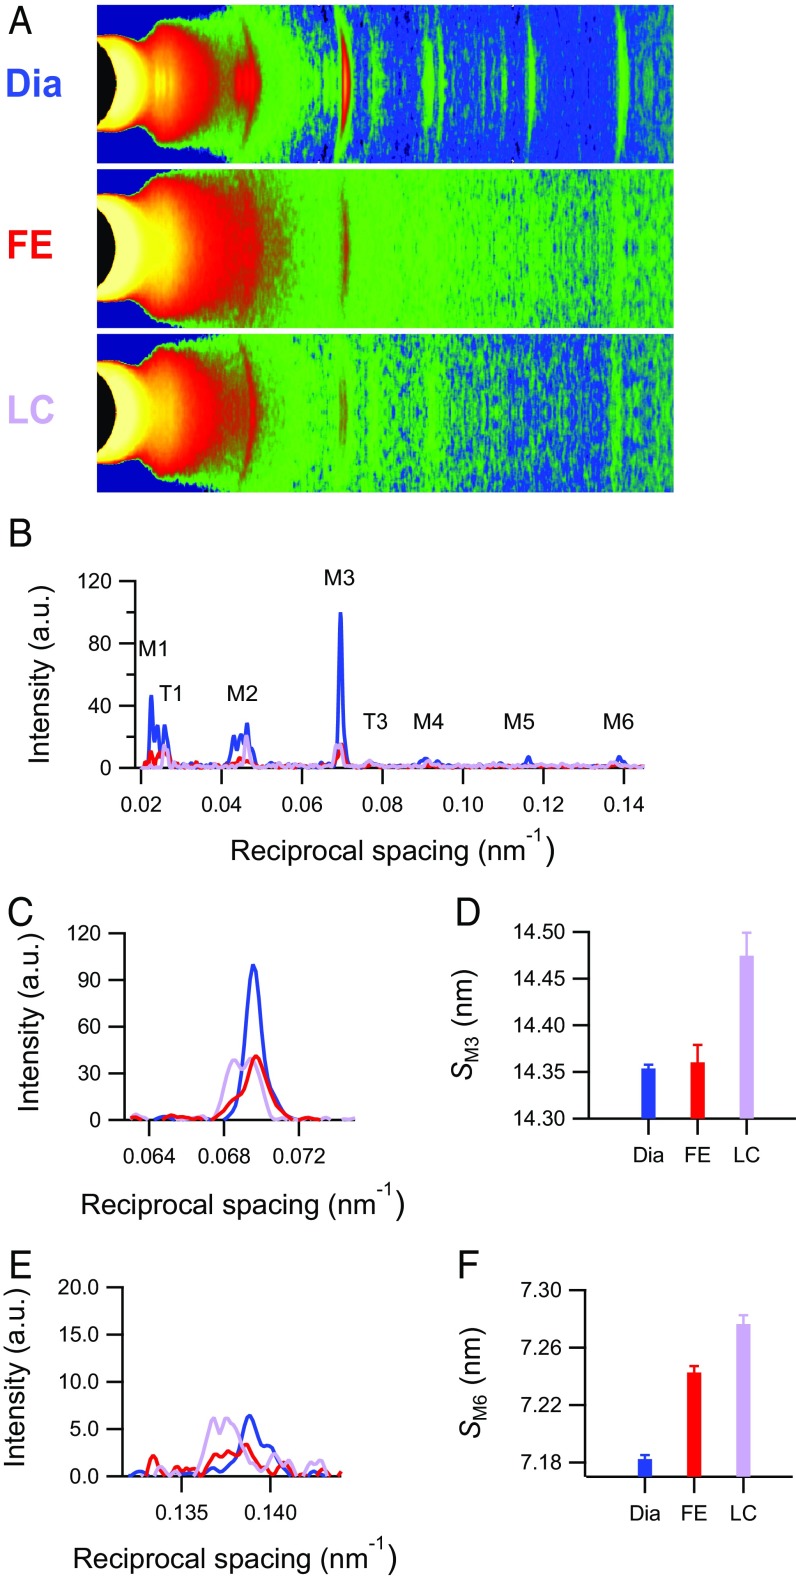
Fig. 2.
X-ray reflections marking the changes in the structure of the myosin filament in a twitching trabecula. (A) Meridional slices and (B) meridional intensity profiles of patterns collected with 1.6-m camera length from four vertically mounted trabeculae. M1–M6 are myosin-based reflections. T1 and T3 indicate troponin-based reflections indexing on a 38-nm axial periodicity. Total exposure times are 150 ms for diastole (Dia), 60 ms for FE, and 90 ms for LC. (C and E) Intensity profiles and (D and F) spacing around the region of M3 and M6 reflections for three conditions as in Fig. 1 (blue, Dia; red, FE; violet, LC).

