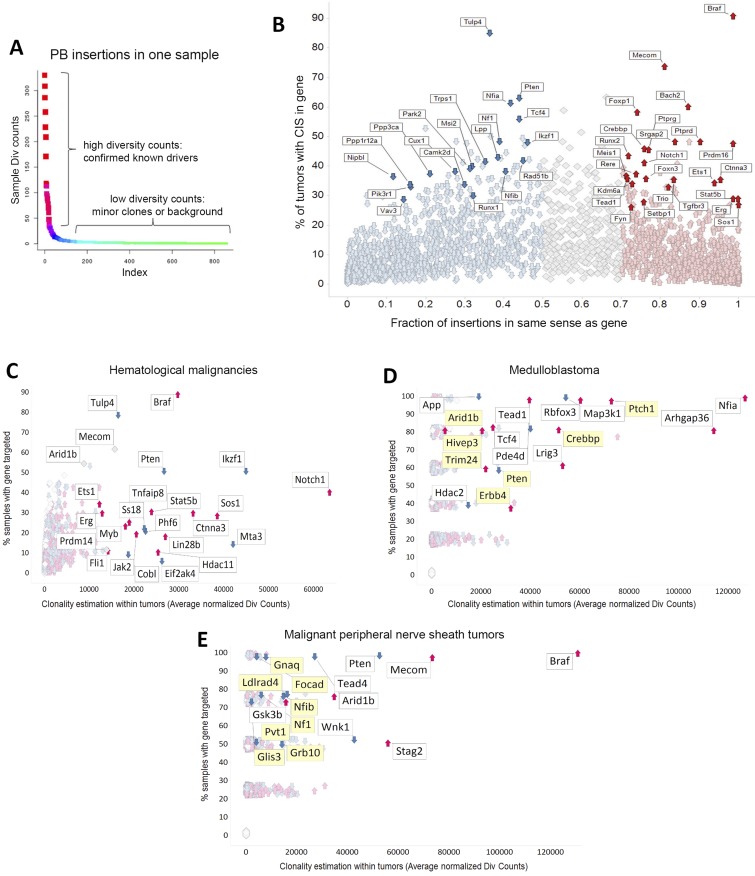
Fig. S3.
Characterization of PB insertion sites in RosaPB/+;ATP2/+;Arf−/− primary tumors. (A) Example of PB insertion pattern in one sample. Our methods allow the identification of CISs from one sample. DNA shearing randomly cuts DNA, allowing us to consider div count. There were at least 105 mapped div counts for each PB arm. (B) Thresholds applied for prediction of GOF or LOF transposon insertions. For each gene, the fraction of PB insertions in same sense as gene was calculated. Less than 50% of insertions in the same orientation is considered a predicted tumor-suppressive effect, whereas >70% of insertions in the same orientation is a predicted oncogene. All 327 RosaPB/+;ATP2/+;Arf−/− tumors sequenced are represented. (C–E) PB insertional patterns in specific indications, from RosaPB/+;ATP2/+;Arf−/− spontaneous tumors. (C) Insertional landscape for 154 hematologic tumors. Ikzf1, Notch1, Stat5b, and Jak2 are examples of genes disrupted in human hematologic disorders and also found also targeted by PB;Arf−/− hematologic tumors. (D) Insertional landscape for five medulloblastoma tumors. Mild y-axis jittering was applied; actual values are provided in Dataset S1. The genes highlighted in yellow are also mutated in human medulloblastomas (36–38). (E) Insertional landscape for four MPNSTs. Mild y-axis jittering was applied; actual values are provided in Dataset S1. The genes highlighted in yellow are also mutated in human MPNSTs (35).

