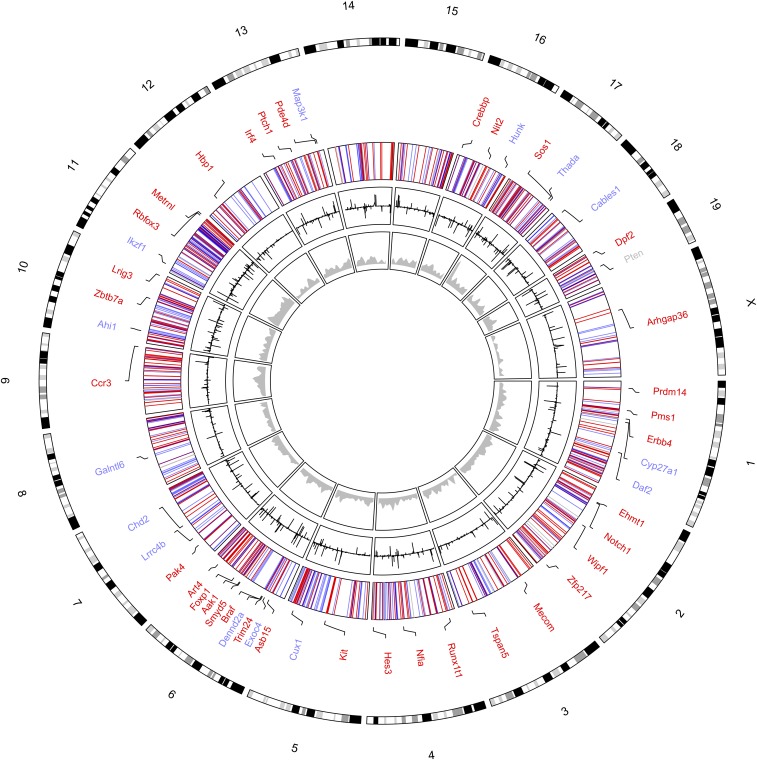
Fig. S4.
Circos plot representing the distribution of CIS insertions in the 327 RosaPB/+;ATP2/+;Arf−/− tumors sequenced. The innermost ring (gray) represents the genomic density of PB insertions in 10-kb windows. Each inserted position is counted once per sample, regardless of the number of reads at this position. The next ring (black) shows the number of unique reads at each position, illustrating the CIS distribution. Bars facing inward represent reads on the negative strand, whereas bars facing outward represent reads on the positive strand. The third ring represents the functional prediction of CISs: GOF (red), LOF (blue), and unpredictable (gray). Mouse chromosomes are shown at the periphery of the plot.

