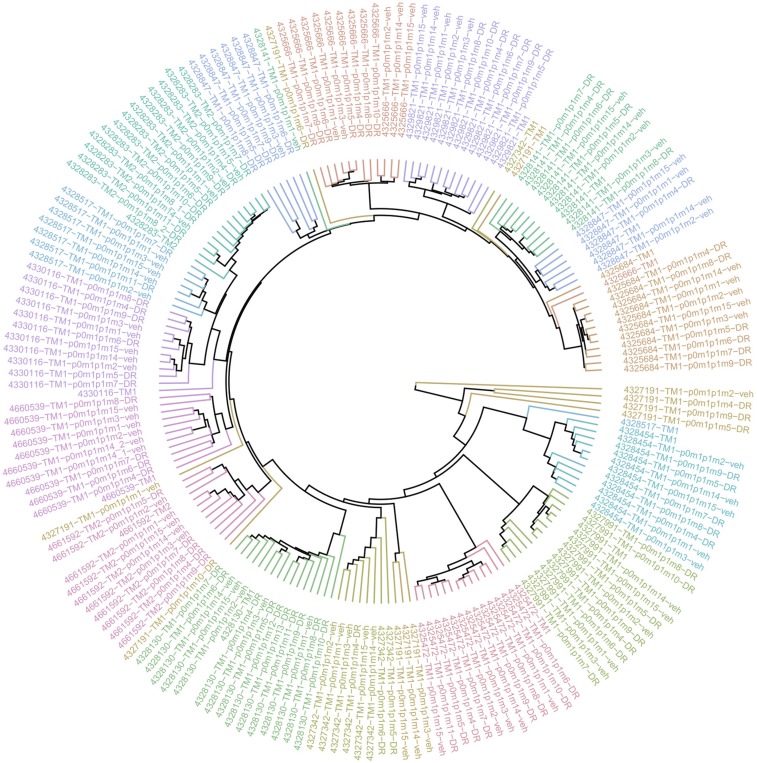
Fig. S6.
Low genetic drift in RosaPB/+;ATP2/+;Arf−/− allografted tumors. The hierarchical clustering analysis, represented as a circular dendrogram, shows the distribution of insertional landscapes of 16 allografted tumor models. Each model is represented by one color. The spontaneous tumors are indicated with tumor ID-TM1 (TM, tumor). The tumor from the first s.c. implantation is designated p0 (passage 0), and further passages are designated p1, p2, etc. m1, m2, m3, etc. refer to the mouse number in p0, or p1 for precise tracking of tumor expansion. For allografted mice that were treated, the treatment is indicated in the sample name. DR, drug resistant; HDM201, mouse treated with HDM201 twice weekly; veh, mouse treated with vehicle twice weekly; SD, mouse treated with vehicle twice weekly and a single dose of HDM201 just before harvesting tumor. We generally observed short clustering distances between samples of same model, suggesting that resistance did not dramatically change insertional patterns.

