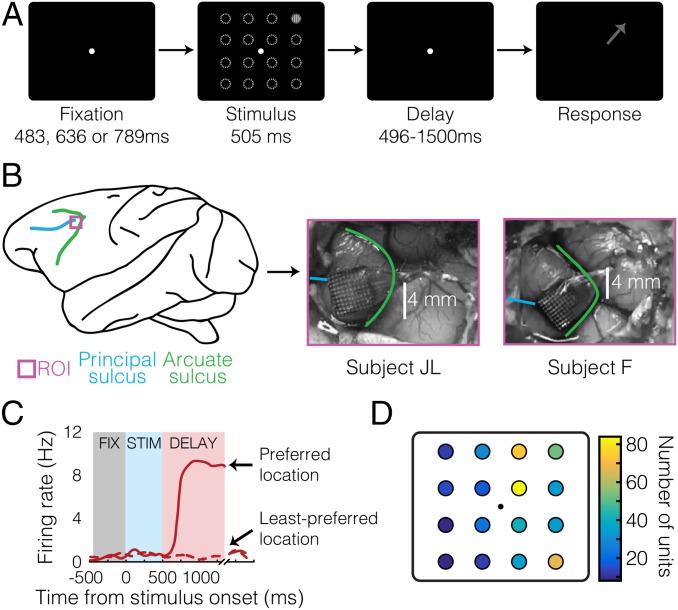
Fig. 1.
Task, method, and single-cell data. (A) Overview of oculomotor delayed-response task. The arrow represents the correct saccade direction. The dashed circles indicate potential cue locations and are shown for illustrative purposes only and are not present in the task. (B) Array implantation sites and anatomical landmarks in both subjects. (C) Example delay-selective neuron. (D) Distribution of delay-selective units’ preferred locations. FIX, fixation; ROI, region of interest; STIM, stimulus.

