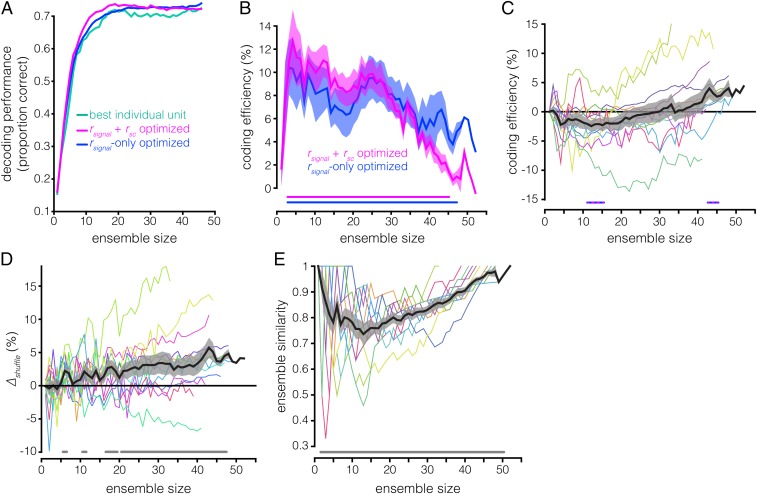
Fig. 4.
Effects of rsc structure on ensemble coding efficiency and composition. (A) Decoding accuracy (y axis) as a function of ensemble size (x axis) for the best individual unit (teal), rsignal + rsc (violet), and rsignal-only (blue) methods for the same example session as in Fig. 3C. Note that, for the rsignal-only ensembles, the classifier was trained and tested on rsc-shuffled data whereas, for the rsignal + rsc and best individual unit ensembles, the classifier was trained and tested on rsc-intact data. (B) Coding efficiency of rsignal + rsc ensembles and rsignal-only ensembles, relative to the best individual unit ensembles (y axis), as a function of ensemble size (x axis). The violet line running along the bottom indicates ensemble sizes for which the rsignal + rsc ensembles are significantly more efficient than the best individual unit ensembles (P < 0.05, paired t test, Hochberg-corrected); the blue line is similar, but for rsignal-only ensembles vs. best individual unit ensembles. Note that the coding efficiency of rsignal + rsc ensembles relative to best individual unit ensembles was previously shown in Fig. 3D. (C) Coding efficiency of rsignal-only ensembles relative to rsignal + rsc ensembles; similar to Fig. 3D. A positive value indicates that shuffling out the rsc structure improves decoding. The striped blue and violet lines running along the bottom indicate ensemble sizes for which the efficiency of rsignal + rsc ensembles and rsignal-only ensembles are significantly different (P < 0.05, paired t test, Hochberg-corrected). (D) Decoding performance of rsc-shuffled vs. rsc-intact ensembles (∆shuffle, y axis) as a function of ensembles size (x axis) for random ensembles. Ensembles were generated by randomly subsampling n units from the full recorded population in a given session. The gray lines running along the bottom indicate ensemble sizes for which the rsc-shuffled vs. rsc-intact ensembles are significantly different (P < 0.05, paired t test, Hochberg-corrected). (E) Similarity between rsignal + rsc ensembles and rsignal-only ensembles (y axis) as a function of ensemble size (x axis). Ensemble similarity is quantified as the proportion of units common to the two ensembles for a given size. Note that ensemble similarity is 1 for ensembles of size n = 1, and for the largest ensemble size in a given session, because both ensemble-building procedures begin with the same unit, and the largest ensemble in each session consists of every simultaneously recorded unit in that session. The gray line running along the bottom indicates ensemble sizes for which the similarity of the rsignal + rsc ensembles and rsignal-only ensembles is significantly less than 1 (P < 0.05, z-test of proportion, Hochberg-corrected).

