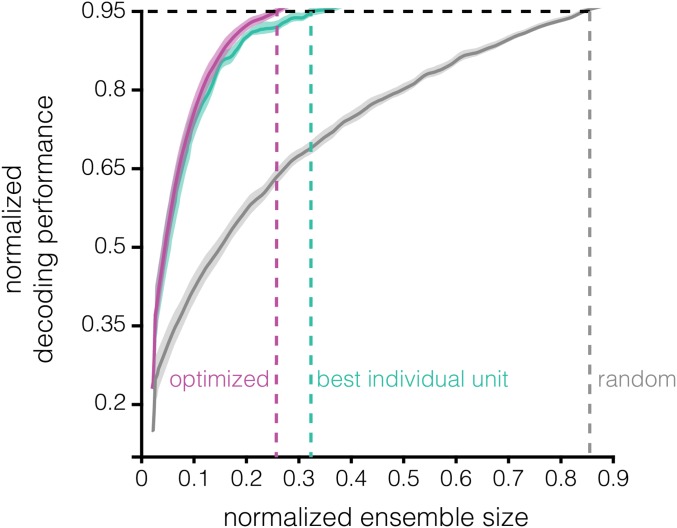
Fig. S2.
Decoding saturation curves for the best individual unit vs. best subensemble methods. Normalized decoding accuracy (y axis) as a function of normalized ensemble size (x axis) is plotted for the best individual unit (teal), optimized (violet), and random (gray) ensembles. The normalized ensemble size at which normalized decoding accuracy of 0.95 is achieved is shown for the three procedures.

