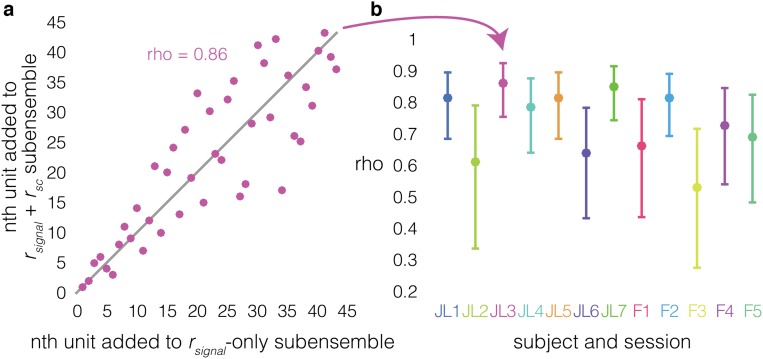
Fig. S6.
Ensemble construction sequence correlation shows that different ensembles maximize WM information when the rsc structure is intact vs. removed. (A) Sequence order correlation between rsignal + rsc ensembles (y axis) and rsignal-only ensembles (x axis) for an example session. The nth unit added to the ensemble in the rsignal-only method (x axis) is plotted against the n at which it was added to the ensemble in the rsignal + rsc method. For example, the fifth unit added in the rsignal-only method is added fourth in the rsignal + rsc method. If the sequence in which the two methods added units was identical, all of the points would fall along the unity line (gray), and the Spearman rank correlation coefficient (ρ) between the two sequences would equal 1, indicating that identical ensembles maximize WM information regardless of whether the rsc structure is intact. Likewise, ρ = 0 means that the relationship between the sequences is random; the ensembles that maximize WM information when the rsc structure is intact are entirely distinct from the ensembles that maximize WM information when the rsc structure has been removed. (B) Spearman rank correlation coefficient (ρ) between the rsignal + rsc ensembles and rsignal-only ensembles (y axis) for each session (x axis). Error bars are Bonferroni-corrected 95% confidence intervals. The correlation between ensemble sequences is significantly less than 1 in every session (P < 0.05, Bonferroni-corrected), indicating that the ensembles that maximize WM information when the rsc structure is intact are built in a different sequence than the ensembles that maximize WM information when the rsc structure has been removed. The range of ρ values (0.53 to 0.86) shows that there is some degree of similarity to the sequences in which the two methods recruit neurons to the ensembles.

