Fig. S7.
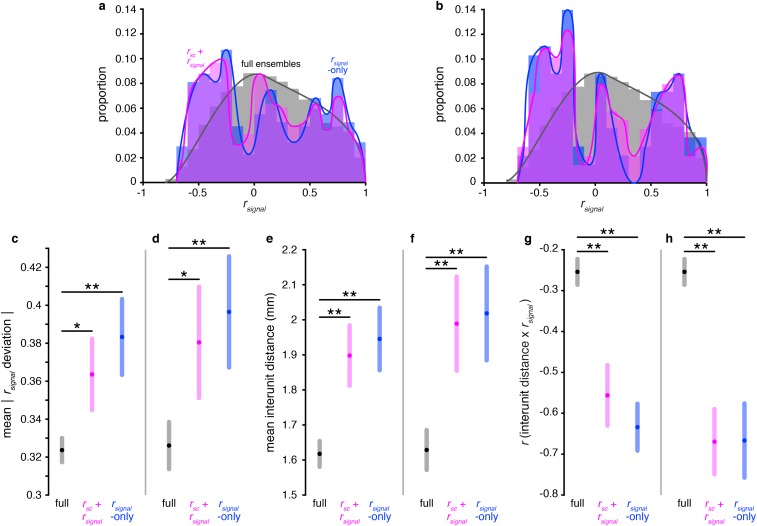
Functional anatomy analyses are consistent even when using different decoding saturation thresholds. (A) rsignal distributions for the full ensembles (gray), near-max rsignal + rsc ensembles (violet), and near-max rsignal-only ensembles (blue), pooled across all sessions. Identical to Fig. 5A, but using a threshold of 90% of maximum decoding. The rsignal + rsc ensemble and rsignal-only ensemble distributions are both significantly different from the full ensemble distributions (P < 0.001, χ2 test, Bonferroni-corrected; computed using nonoverlapping bins of size = 0.1). (B) Identical to A, but using a threshold of 80% of maximum decoding. All three distributions are significantly different from each other (P < 0.001, χ2 test, Bonferroni-corrected; computed using nonoverlapping bins of size = 0.1). (C) Mean |rsignal deviation| in the three categories of ensembles. Identical to Fig. 5B, but using a threshold of 90% of maximum decoding. rsignal deviation is defined as the difference between a unit pair’s rsignal and the mean rsignal of the ensemble to which the unit pair belongs. Shaded regions represent Bonferroni-corrected 95% comparison intervals between group means (Materials and Methods). (D) Identical to C, but using a threshold of 80% of maximum decoding. (E) Mean interunit distance in each of the three ensemble groups. Identical to Fig. 5C, but using a threshold of 90% of maximum decoding. Shaded regions represent Bonferroni-corrected 95% comparison intervals between group means. (F) Identical to E, but using a threshold of 80% of maximum decoding. (G) Correlation between interunit distance and rsignal in the three ensemble groups. Identical to Fig. 5D, but using a threshold of 90% of maximum decoding. Shaded regions represent bootstrapped 95% confidence intervals. (H) Identical to G, but using a threshold of 80% of maximum decoding. *P = 0.01, **P << 0.001, F test (Materials and Methods).

