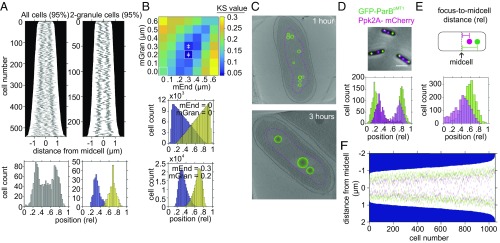
Fig. 4.
PolyP granules are spatially organized 3 h into nitrogen starvation. (A) (Top Left) Demograph of granules contributing to 95% of total granular volume per cell of all 3 h-starved cells imaged by TEM. (Bottom Left) Histogram of relative position of granules along the long axis of cells imaged by TEM as above. (Top Right) Demograph of 3 h-starved cells with two granules imaged by TEM. (Bottom Right) Histogram of relative position of granules along the long axis of cells imaged by TEM as above. First granule, 0.32 ± 0.06 (blue), and second granule, 0.68 ± 0.08 (yellow). (B) (Top) Heat map of KS test statistic from comparing the experimentally observed distribution of granules in two-granule cells to a simulation of randomly positioning granules along the long axis of the cell, with two added constraints: first, a minimum distance between granules and cell poles (mEnd) and second, a minimum distance between first and second granule (mGran). Symbol ǂ indicates parameter space where the model is statistically indistinguishable from the data. See Methods and SI Appendix, Fig. S6 and SI Methods, for more detailed description. (Middle) Histogram of relative granule position along long axis of cells from a simulation of 229,000 cells in which the only constraint is that granules cannot overlap along long axis of the cell (mEnd = 0, mGran = 0). (Bottom) As in Middle, with the added constraints that granules must be a minimum of 0.3 µm from cell poles and 0.2 µm from each other. (C) (Top) Cryotomogram of WT cell 1 h after inducing starvation. Granules are represented as green spheres, and the nucleoid region is outlined with a magenta dotted line. (Bottom) As in Top, at 3 h. (D) (Top) Example cells with nucleoid origins labeled using the GFP-ParBpMT1 chimera and the parSpMT1 DNA binding site on the chromosome at the attTn7 site (green), and polyP granules labeled with the Ppk2A-mCherry chimera (magenta), replacing the native copy of ppk2A on the chromosome. (Scale bar, 0.5 μM.) (Bottom) Histogram of relative position on long axis of the cell of GFP foci (0.25 ± 0.08 and 0.76 ± 0.09; green) and mCherry foci (0.34 ± 0.13 and 0.71 ± 0.10; magenta). (E) Histogram of relative position of GFP and mCherry foci from midcell, 0.28 ± 0.07 and 0.20 ± 0.09, respectively. P < 0.01 by Student’s t test. (F) Demograph representation of position of nucleoid origins (green) and polyP granules (magenta).

