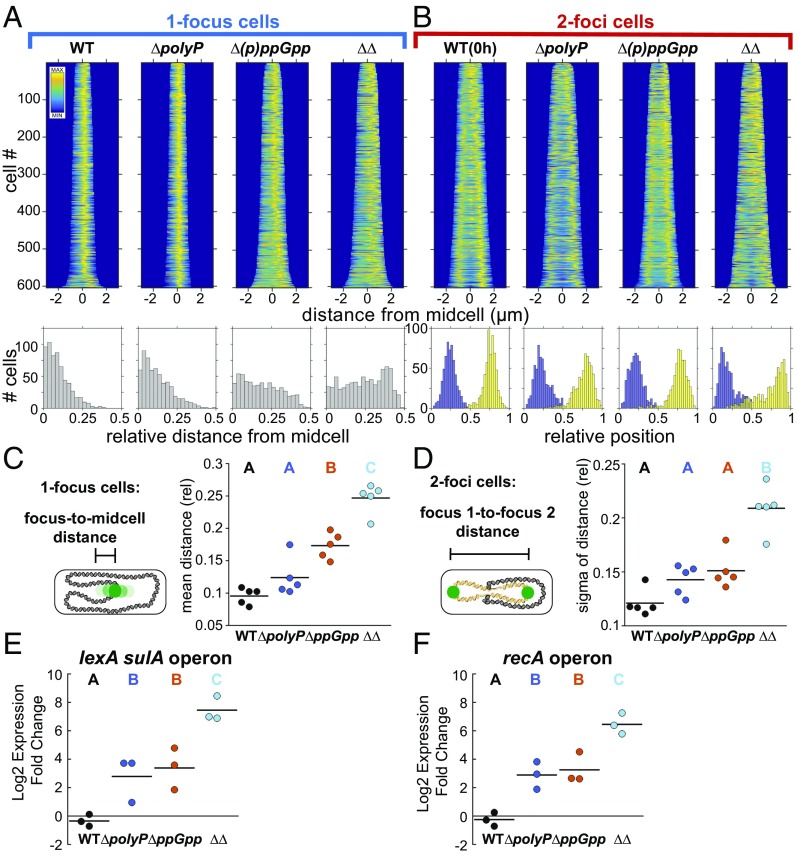
Fig. 6.
PolyP and (p)ppGpp have synergistic effects on nucleoid organization and the SOS DNA damage response. Variance analyzed using a one-way ANOVA. Significant differences between strains at the same time point are marked with uppercase letters based on post hoc Tukey test. Strains marked with different letters have significantly different means. P < 0.05. (A) (Top) Fluorescence demographs of cells with one GFP-ParBpMT1 focus, 24 h nitrogen starvation, using GFP-ParBpMT1 chimeric reporter under the SSB promoter and the parSpMT1 DNA binding site at the attT7 locus. (Bottom) Histograms of relative distance from midcell of GFP-ParBpMT1 foci. (B) (Top) As in A but for two-foci cells. (Bottom) Relative position of first GFP-ParBpMT1 focus (blue) and second focus (yellow) on long axis of cell, normalized to 1. (C) Relative distance from midcell of GFP-ParBpMT1 foci in one-focus cells as above. Each point represents the population mean from an independent experiment. P < 0.05 for strains marked with different letters. (D) Broadness of distribution (sigma) of relative distance of GFP-ParBpMT1 foci to each other in a population of two-foci cells. Each point represents an independent experiment. P < 0.001. (E) Relative change in expression 3 h into nitrogen starvation relative to 0 h of lexA sulA operon, mRNA quantification by qPCR. Each point represents an independent experiment. P < 0.05. (F) As in E, for recA operon. P < 0.01.

