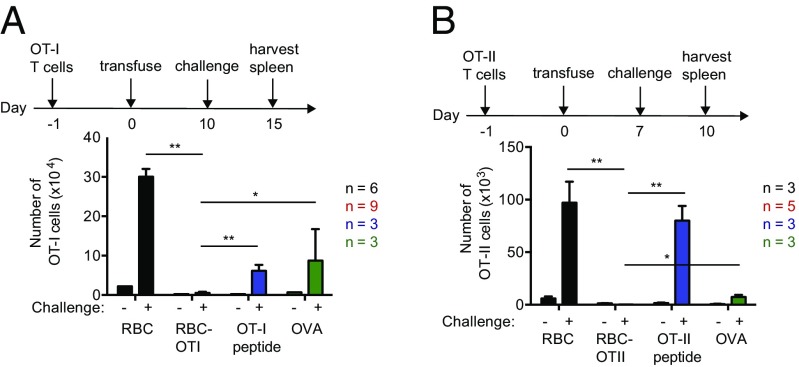
Fig. 3.
Engineered RBCs blunt responses of OVA-specific CD4 and CD8 T-cell responses. (A) Total number of OT-I T cells in spleen following a challenge with saline (−) or OT-I peptide/CFA (+) at day 10. (B) Absolute number of OT-II T cells in spleen, 3 d after challenge with saline (−) or OVA/CFA (+) at day 7. Data are shown as mean ± SD and represent at least two independent experiments. Statistically significant differences are indicated by asterisks: *P < 0.05; **P < 0.01 (unpaired t test with Holm–Sidak adjustment).

