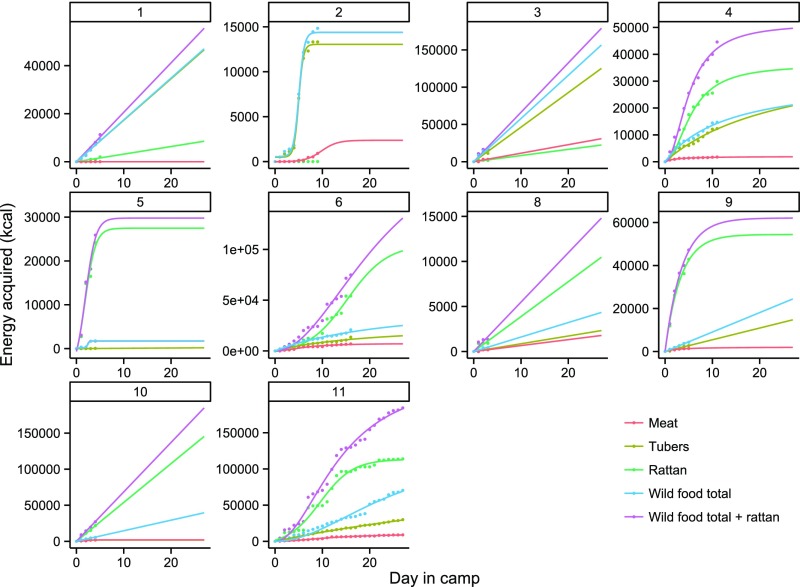
Fig. 2.
The gain functions illustrating energy acquisition at each Batek camp (camps 1–11, excluding camp 7). Data are represented on a standardized 25-d x axis. Colors indicate different resource sets. Ethnographers were not present for the establishment of camps 1, 4, and 8. The gain curves for these camps are shown only for graphical purposes.

