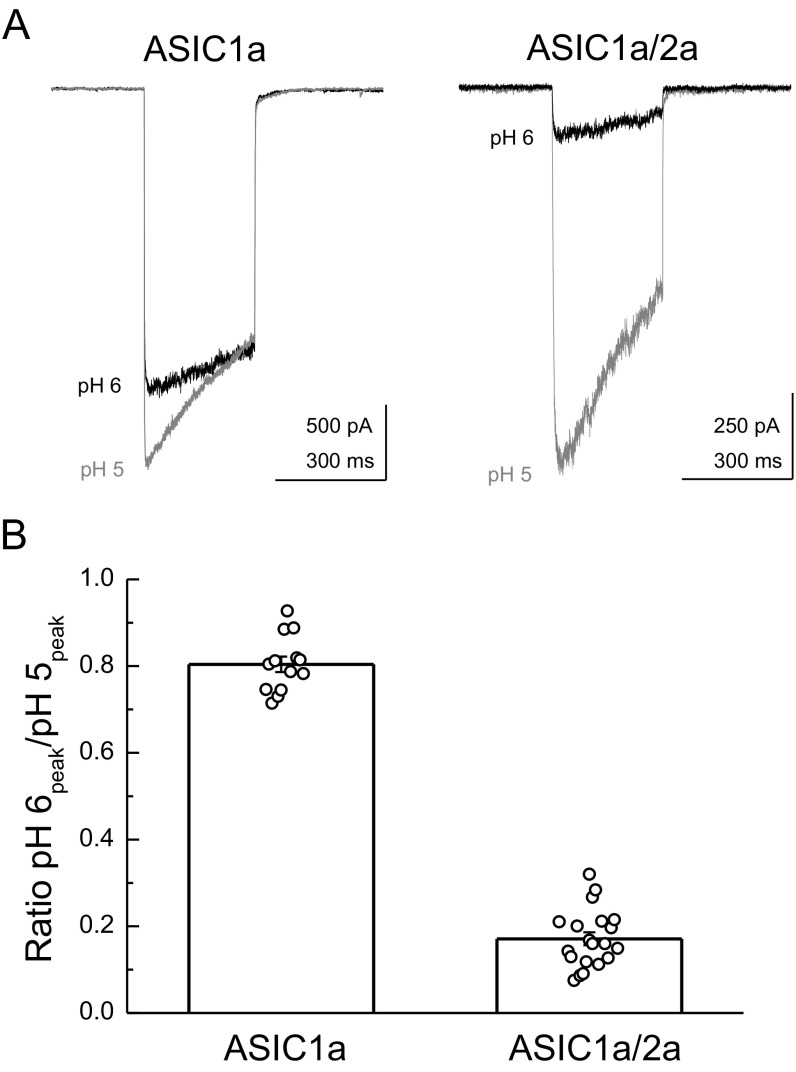
Fig. S3.
Cotransfection of ASIC1a/2a resulted in heteromeric channels. (A) ASIC1a (Left) and ASIC1a/2a (Right) responses to pH 5 (gray traces) or pH 6 (black traces) applications. (B) Summary of the pH 6-to-pH 5 ratio across 13–20 patches (bar graph) and for each individual patch (circles). Error bars show SEM.

