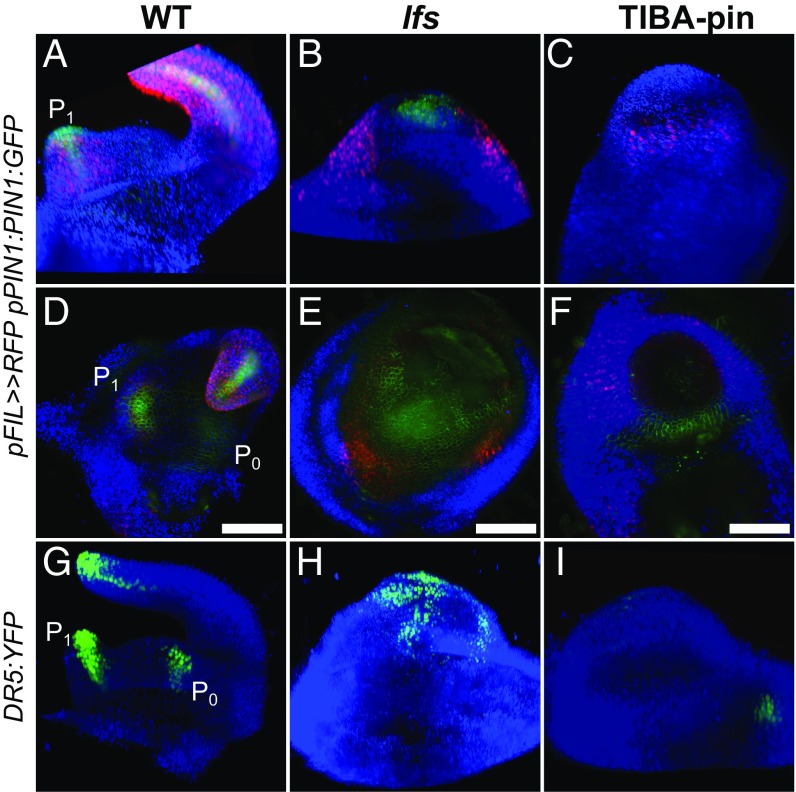
Fig. 2.
Auxin distribution is impaired in lfs and in TIBA pins. (A–F) Expression profiles in pFIL>>NLS:RFP pPIN1:PIN1:GFP apices, as captured by a light sheet microscope. Similar analyses by confocal imaging are presented in Fig. S2. (A–C) Three-dimensional reconstructed projections. (D–F) Top view, obtained using maximum-intensity projection. (G–I) Three-dimensional reconstruction of DR5:YFP apices. Note that the patchy pattern in lfs (H) does not correspond with the discrete primordia. (Scale bars in D–F: 100 µm.)

