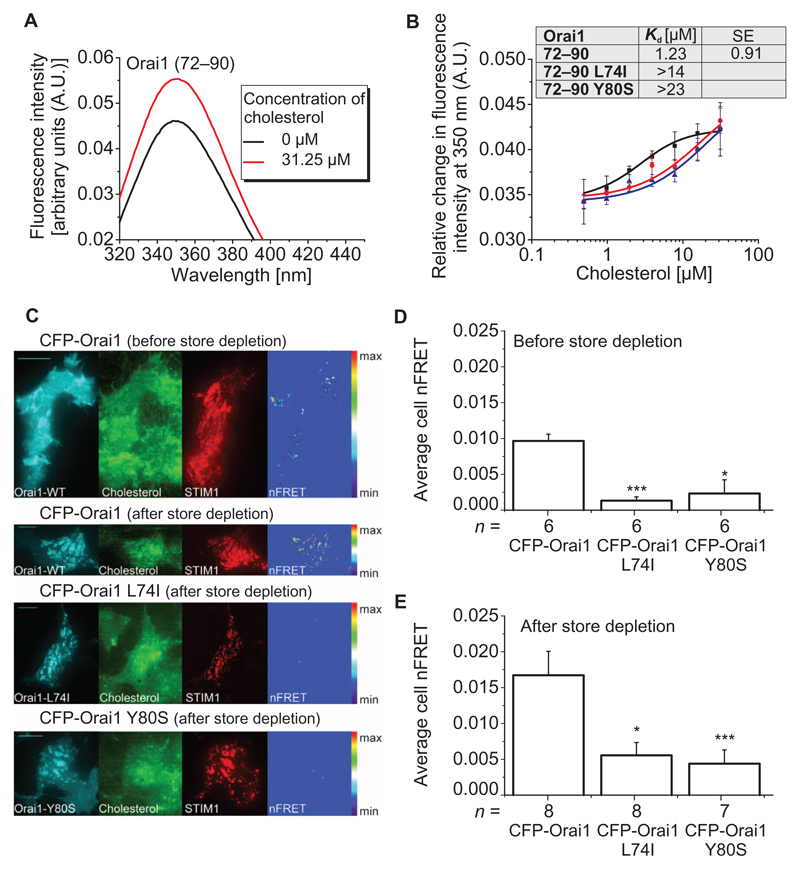
Fig. 4. Mutant Orai1 N-terminal peptides and full-length Orai1 mutant channels display reduced association with cholesterol compared to WT peptides and Orai1.
(A) Intensity profile of Orai1 (72–90) N-terminal peptide in the absence and presence of cholesterol. The figure is representative of three independent experiments. (B) Binding curves displaying changes in the intrinsic fluorescence of Orai1 (72–90), Orai1 (72–90) L74I, and Orai1 (72–90) Y80S with increasing cholesterol concentrations. Inset shows the apparent Kd of the WT peptide compared to the mutants. Each binding curve for the WT and mutant peptides is derived from the average of n = 3 independent experiments. Error bars are SDs. Excitation wavelength was 280 nm in (A) and (B). (C) FRET-TIRF microscopy of HEK293 cells before and after store depletion. Cells were transfected with the indicated Orai construct and mCherry-STIM1 (STIM1) and loaded with TopFluor Cholesterol (Cholesterol). Images on the right (nFRET) show FRET-positive pixels after correction for bleedthrough and non-colocalization. (D and E) Average nFRET of cells expressing the indicated Orai construct before and after (E) store depletion. Statistical analysis was performed with t test (control: CFP-Orai1, **P < 0.05 and ***P < 0.005). n represents the number of tested cells, which have been taken from three to five transfections. Scale bars, 10 µm.

