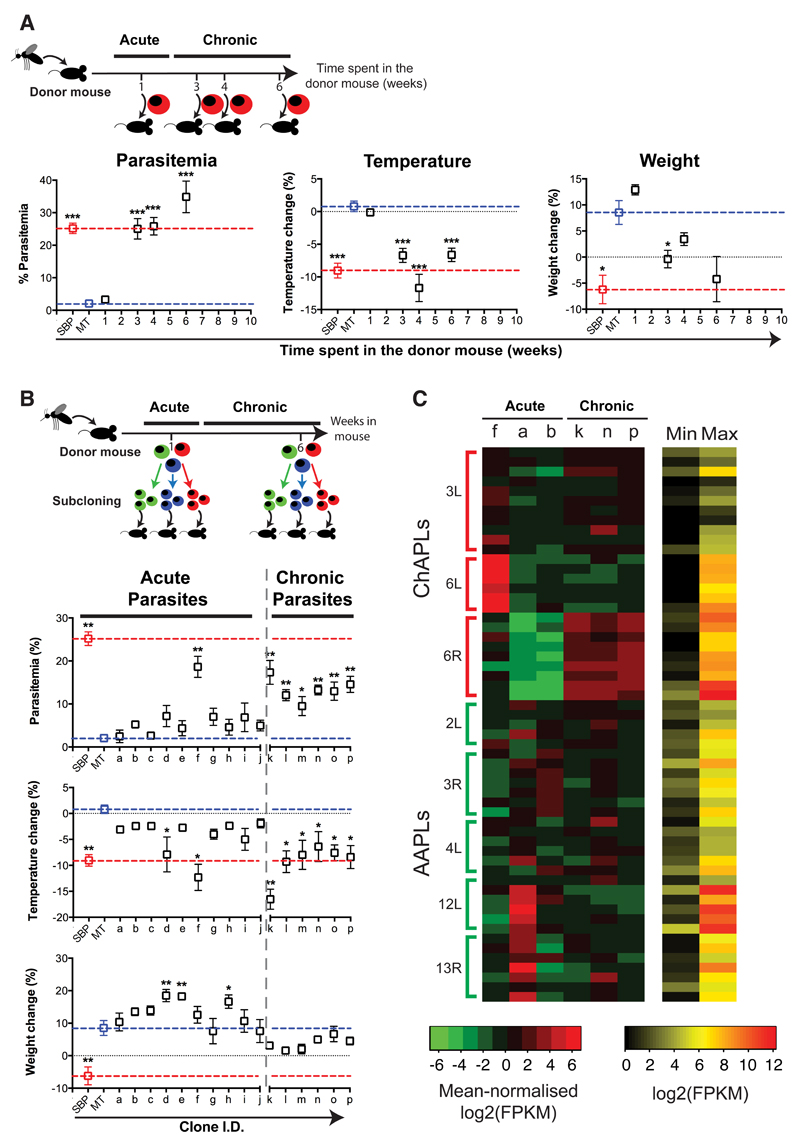
Figure 3. Chronic infections select for virulent P. chabaudi parasites expressing distinctive clusters of pir genes.
Donor mice were infected by mosquito bites. (A) Parasites were subsequently passaged into naïve recipient mice after one, three, four or six weeks (n=15 mice per group). (B) Individual parasites were cloned during the acute and chronic phases of infection. After their expansion, clonal populations of parasites were used to infect recipient mice (n= 5 mice per clone). In (A) and (B), we show maximum parasitaemia, temperature change and weight change for recipient mice compared to mice directly infected by mosquito bites (MT; blue dotted line) or with serially blood passaged parasites (SBP; red dotted line). Each dot represents the mean ± standard error of the mean (SEM) of 5 individual mice. Each group has been compared to mice infected with 105 MT parasites (*P<0,05; **P<0,01; ***P<0,001, two-sided Mann Whitney Test). (C) Heatmap of pir gene expression at ChAPLs and AAPLs in three acute and three chronic clones. The first three columns represent cloned parasite lines derived from from the acute phase (f, a, b), the next three columns represent cloned lines from the chronic phase (k, n, p) from 3 individual mice. On the side, chromosomes numbers are indicated as well as the location on that chromosome: L for left hand, R for right hand. ChAPLs and AAPLs are highlighted. For each gene, red represents its maximal expression, green its minimal expression. The absolute maximum and minimum values for each gene are shown in a separate heatmap.

