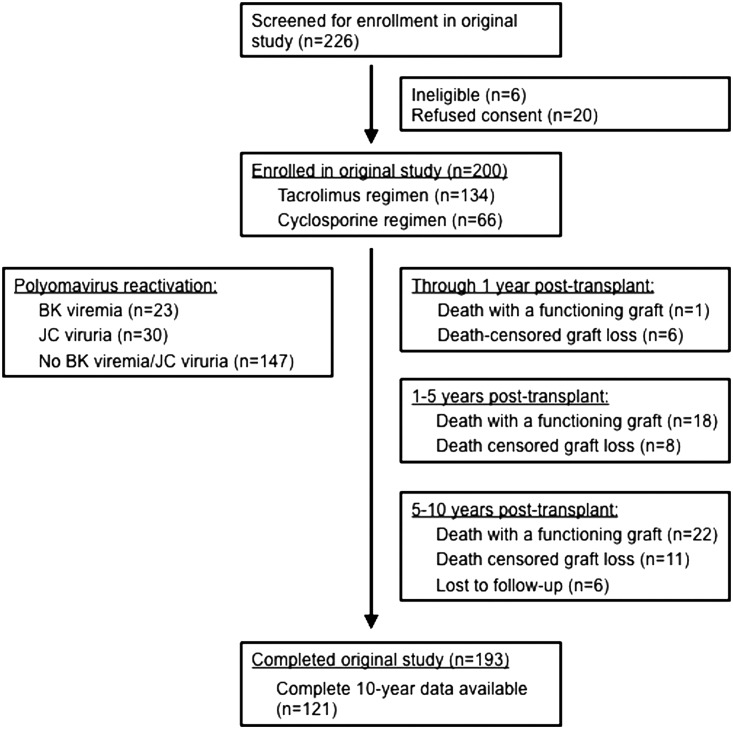
Figure 1.
Flow diagram showing the characteristics of the study cohort at 1, 5, and 10 years post-transplant. Subjects from the original randomized trial (n=200) had clinical data collected for up to 10 years post-transplant. Subjects who were alive with functioning grafts at the end of the original 1-year study (n=193) were included in this retrospective cohort analysis. Polyomavirus reactivation data on the left side of the figure reflects serial testing during year 1 post-transplant.

