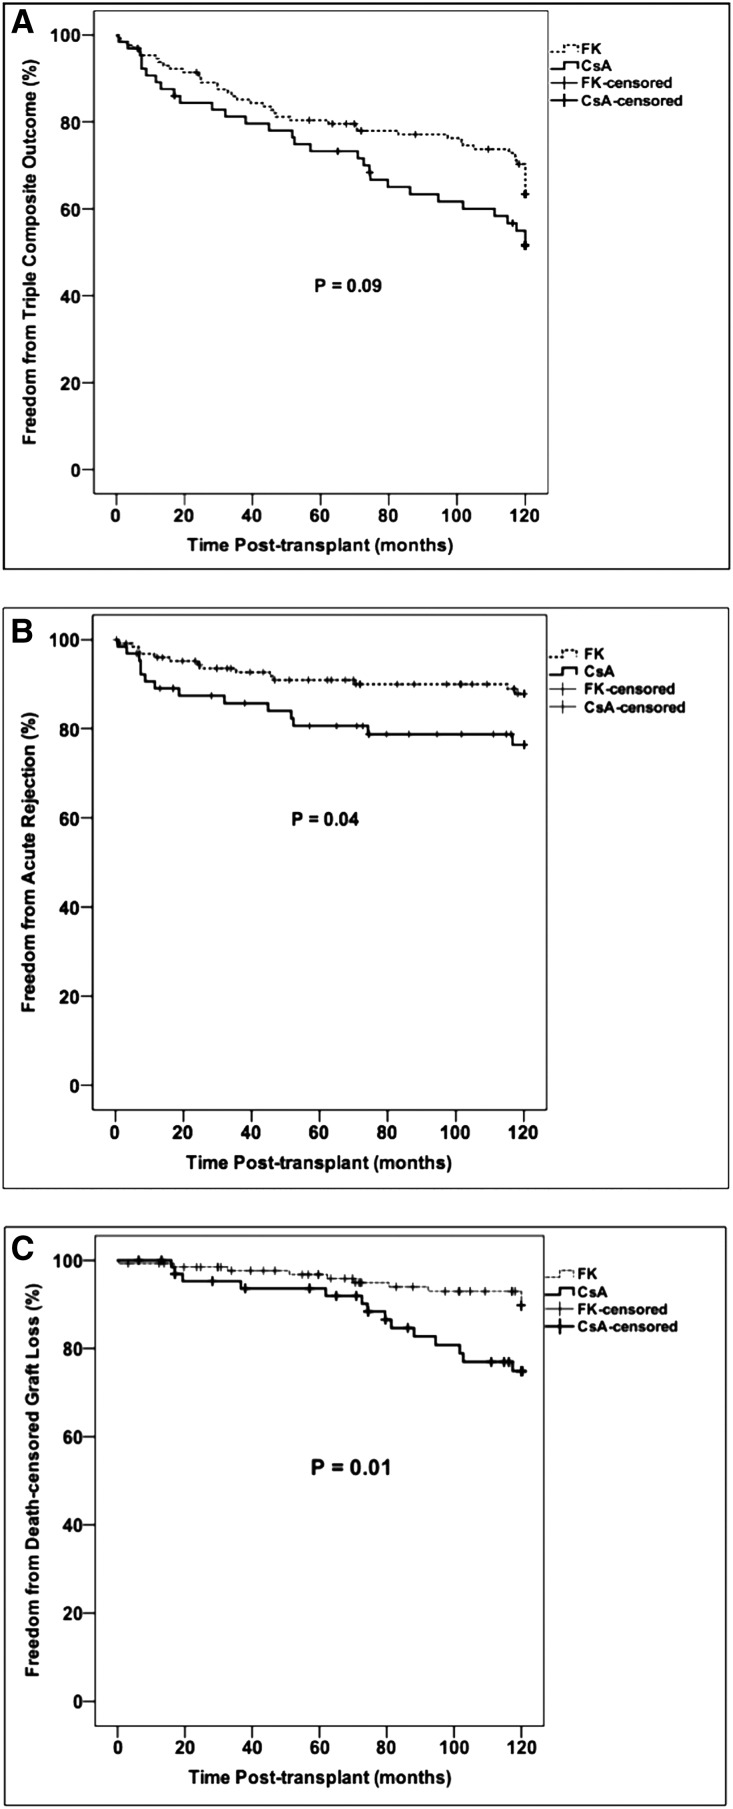
Figure 2.
Kaplan–Meier analysis of 10-year outcomes according to calcineurin inhibitor. (A) Ten-year incidence of the triple composite outcome, (B) 10-year incidence of acute rejection, and (C) 10-year incidence of death-censored allograft loss. Comparisons between survival curves were made using the log-rank test. CsA, cyclosporin; FK, tacrolimus.

