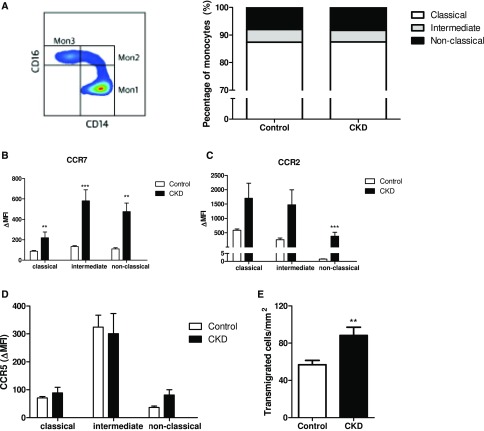
Figure 2.
Monocytes of CKD subjects show increased expression of chemokine receptors and enhanced migratory capacity. Flow cytometry on whole blood was performed to study expression of monocyte surface markers. Monocytes were divided into classic (CD14++CD16−), intermediate (CD14++CD16+), or nonclassic (CD14(+)CD16+) monocytes. (A) Surface expression of monocyte CCR7, CCR2, and CCR5 represented as Δ median fluorescence intensity (MFI), in CKD subjects (n=14) versus controls (n=14). (B, C, D) Transendothelial migratory capacity was quantified as the number of transmigrated cells per millimeter2. (E) For each subject, transmigrated cells are calculated of independent counts of five frames of view. Data represent mean±SEM. *P<0.05; **P<0.01; ***P<0.001.

