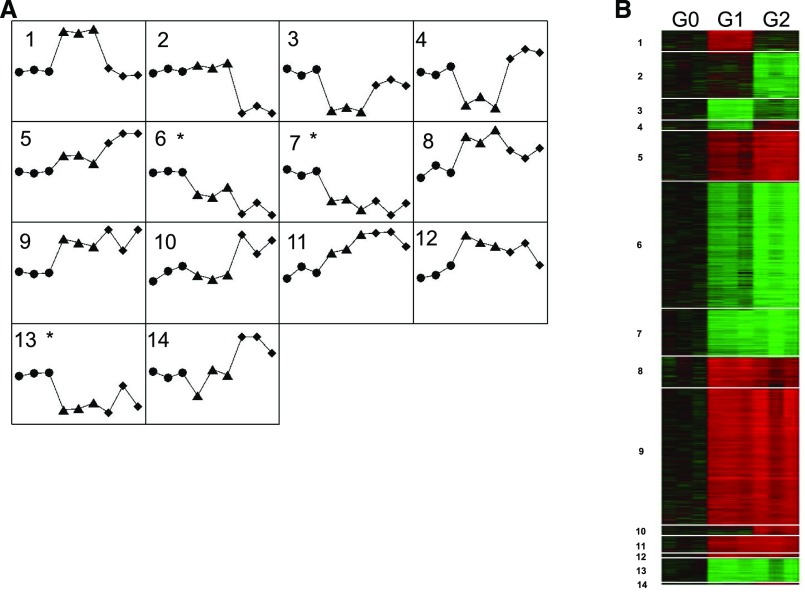
Figure 2.
Illumina human HT-12 v4 arrays identify significantly clustered gene expression patterns for HEK293 Tet-on APOL1 G0, G1, and G2 cells. From top to bottom are 1699 transcripts, in order from pattern 1 to pattern 14. (A) Gene expression patterns most altered in HEK293 Tet-on G0 (circle), G1 (triangle), and G2 (diamond) cells with Dox induction. Asterisk indicates that mitochondrial pathway enrichment is present (patterns 6, 7, and 13). (B) Heat map of clustered gene expression patterns: transcript expression in G0 shown in black; red and green correspond to up and downregulation, respectively, by G1 or G2. Lighter colors denote less differential expression.

