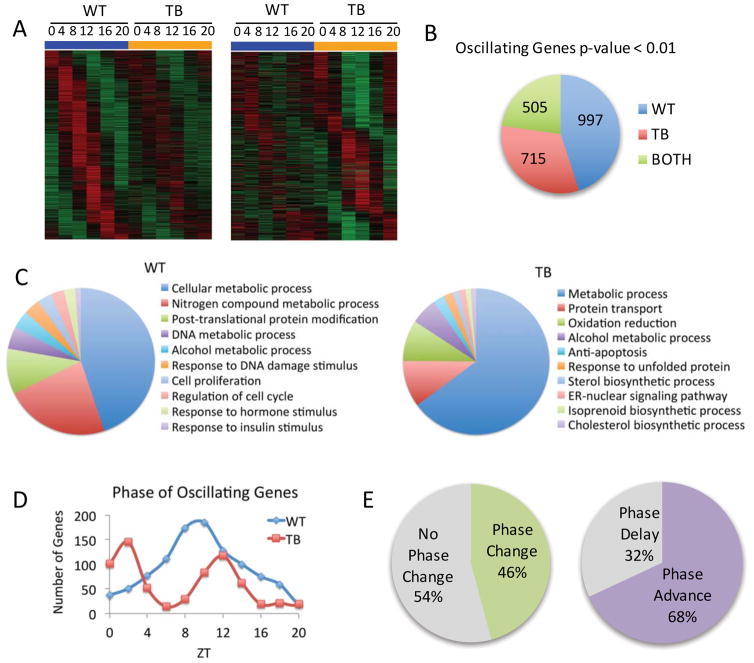
Figure 1. Lung adenocarcinoma rewires the circadian hepatic transcriptome.
A) DNA microarray analysis was performed using mouse liver total RNA from ZT 0, 4, 8, 12, 16 and 20. Using JTK_cycle, genes selected to be circadian at a p-value <0.01 are displayed as heat maps for WT and lung tumor-bearing (TB) livers. Left panels display circadian genes exclusively in WT mice and right panels show genes with more robust oscillation in TB mice. B) Pie charts indicate actual numbers of circadian genes that oscillate exclusively in WT, TB or BOTH conditions. C) Top 10 gene ontology (GO) terms for biological process were identified by DAVID pathway analysis tool, based on a 0.01 p-value cutoff. D) Phase analysis of WT and TB-specific oscillating gene expression profiles. E) Phase analysis of ‘BOTH’ genes that remain circadian in WT and TB mice.

