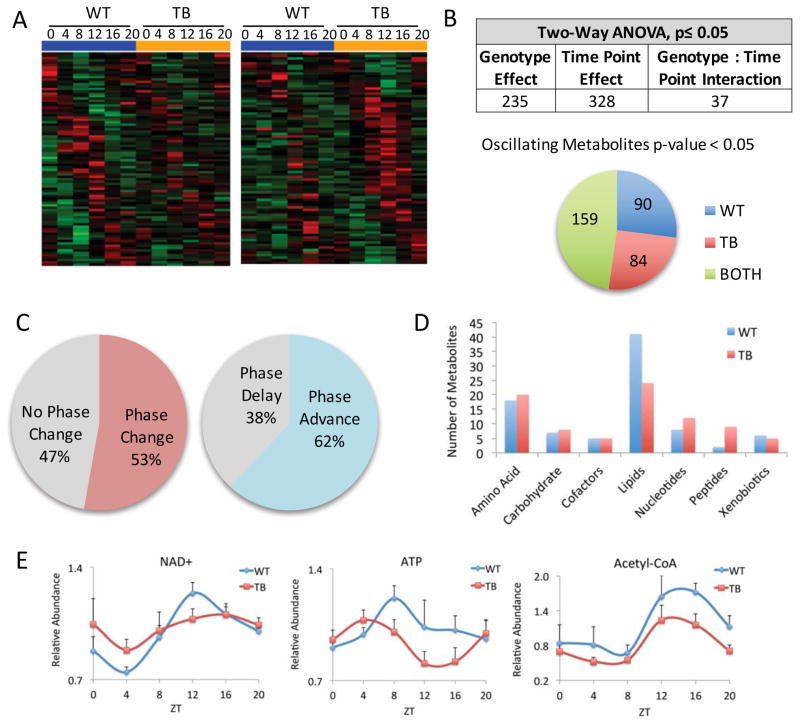
Figure 2. The circadian metabolome is reorganized by lung cancer.
A) Heat maps displaying oscillating metabolites as determined by JTK_cycle (p-value <0.05) in WT and TB mice. Left panels display circadian metabolites exclusively in WT liver and right panels show metabolites with more robust oscillation in TB mice. B) Two-way ANOVA analysis using a p-value cutoff of 0.05 reveals metabolites that are responsive to lung tumors, circadian time point, or both. Numbers of oscillating metabolites using JTK_cycle are indicated from WT, TB or BOTH categories. C) Phase analysis was performed using JTK_cycle to identify the phase of peak metabolite expression. D) Oscillating metabolites are displayed based on biological sub-pathway, including amino acid, carbohydrate, cofactors, lipids, nucleotides, peptides and xenobiotics. E) Examples of energetic metabolites that are dampened in TB mice. NAD+= nicotinamide adenine dinucleotide; ATP= adenosine 5′-triphosphate.

