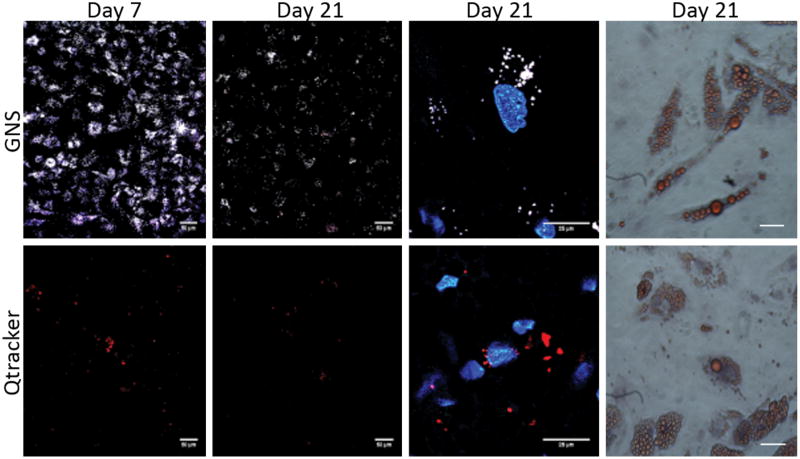
Figure 2.
ASC adipogenic differentiation following labeling with GNSs and Qtracker. For all studies, ASCs were incubated with 0.14nM GNSs and 0.14nM Qtracker for 24 hours prior to differentiation. In columns 1 and 2, for adipogenesis on the 7th and 21st day of differentiation, images were taken with MPM to monitor the TPL of the labels (scale bars = 50μm). Images in the third column show labeled ASCs on the 21st day of differentiation at 5× zoom with GNSs and Qtracker (scale bars = 25μm). Images in the third column were stained with Hoechst33342. The last column represents the confirmation of phenotypic differentiation with Oil Red O for adipogenesis (scale bars = 100μm). For adipogenesis, the cells labeled with GNSs could be easily visualized over a period of 21 days and to a greater extent than with the Qtracker label. Results similar to those shown in this figure were seen in osteogenesis and chondrogenesis as well. All samples were imaged with MPM using a wavelength of 800nM at 3.7mW.

