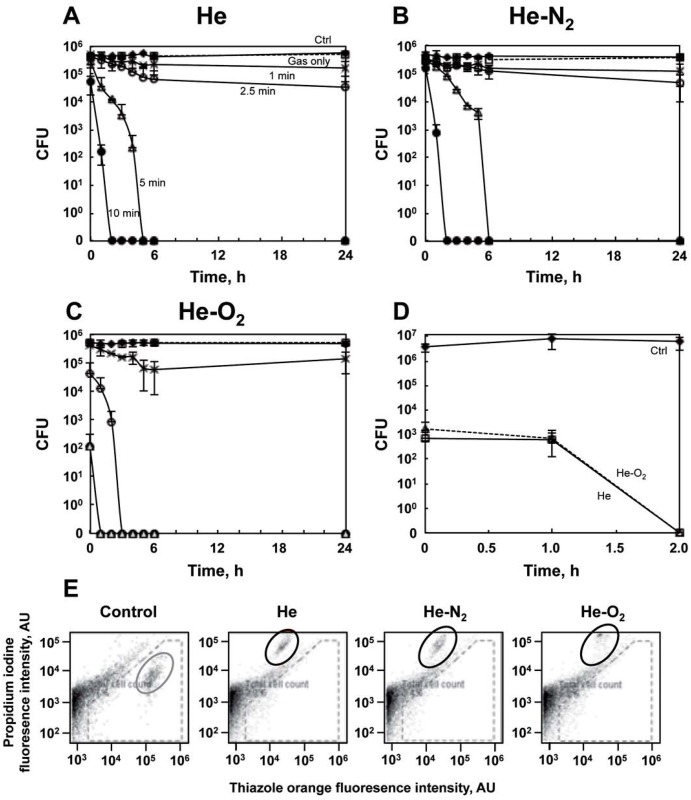
Fig 1. Effect of plasma exposure on bacteria inactivation and viability.
A: Survival curves obtained by CFU counting method for E. coli bacteria exposed to He plasma for different times (black diamond, control; white square, He gas only; black cross, 1 min He plasma treatment; white circle, 2 min 30 s; white triangle, 5 min and black circle, 10 min) and left for different post-treatment storage times 2, 3, 4, 5, 6 and 24 h in PBS at 4°C. B: Survival curves for E. coli exposed to He-N2 plasma for different times (black diamond, control; white square, He only; black cross 1 min He-N2 plasma treatment; white circle, 2 min 30 s; white triangle, 5 min and black circle, 10 min); and left for different post-treatment storage times. C: Survival curves for E. coli exposed to He-O2 plasma for different times (black diamond, control; white square, He only; black cross, 1 min He-O2 plasma treatment; white circle, 2 min 30 s; white triangle, 5 min and black circle, 10 min) and left for different post-treatment storage times. D: Survival curves obtained by MPN method for E. coli exposed to He plasma (white square) and He-O2 plasma (white triangle) for 10 min and different post-treatment storage times (1 hr and 2 hr). Non-treated bacteria (black diamond). The values are means ± SEM of 3 separate experiments. E: Flow cytometry analysis of bacteria after 10 min plasma treatment (He, He-O2 and He-N2) and one hour post-treatment storage. Cells were initially gated on an FL2-A vs SSC-A plot (dashes). Simultaneous staining with thiazole orange (TO) and propidium iodide (PI) allowed the distinction between live (TO+PI−, red circle), dead (TO+PI+, black circle), and injured (TO+PIint, dark grey) cell populations, revealing increased cell injury and death in the treated sample as expected. The TO−PI+ population was excluded from the analysis as debris.

