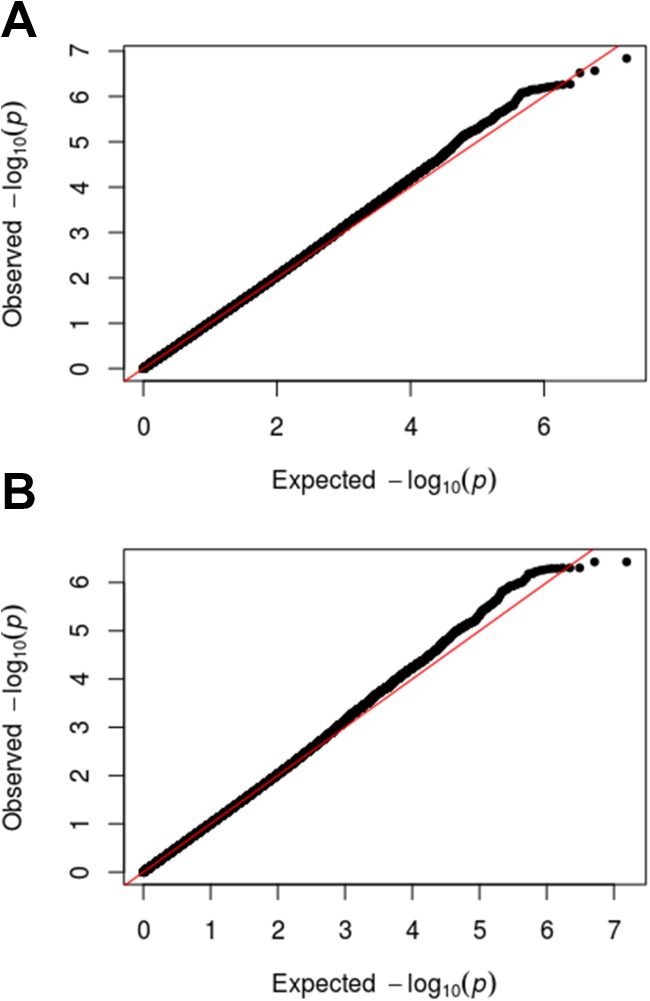
Fig 1.
QQ plots for Achilles tendon injury (A) or ACL rupture (B). The plots show the observed p-values plotted on the y-axis (black dots) against the p-values expected by chance plotted on the x-axis (red line). The black dots align closely with the red line indicating that there is little or no statistical signal in either the Achilles tendon injury or ACL rupture cohorts.

