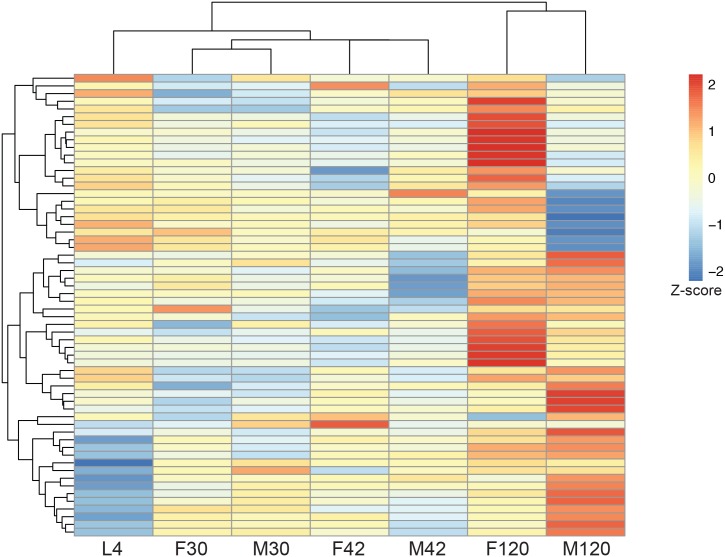
Fig 3. Clustering of stages and Wolbachia DE genes.
Hierarchical clustering of Wolbachia DE genes and developmental stages, L4 through 120 days post infection (dpi) male (M) and female (F), based on gene expression in normalized FPKMs. Expression values were scaled prior to clustering using a Z score calculation, with red representing high expression and blue representing low expression. Biological replicates were combined prior to clustering.

