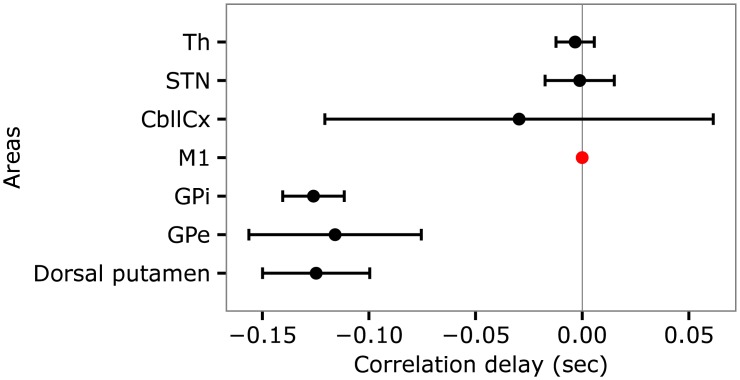
Fig 8. Delays between the onset of the average activity in M1 and the onset of the average activities in the other areas of the model in the case of a tic.
The black dots indicate the means whereas the bars indicate the standard deviations. The red dot indicates the reference with respect to which the cross-correlation was computed.

