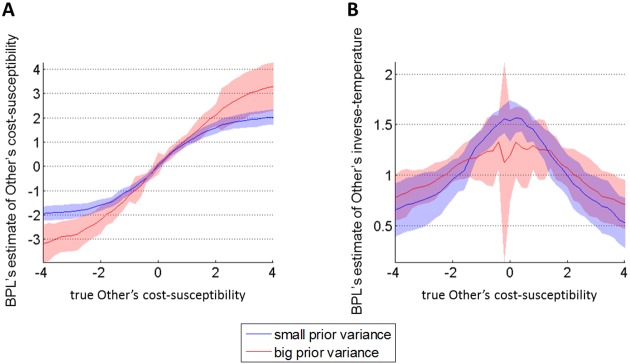
Fig 1. Response of the BPL model.
We simulated virtual BPL learners equipped with neutral priors (), who learned about agents (endowed with varying cost-susceptibilities) performing cost-benefit arbitrages (T = 40 choices, as in the main experiment). The Monte-Carlo average (plain lines) and standard deviations (shaded areas) of BPL's posterior estimates were obtained by repeating this simulation with random pairings of benefits and costs. We also varied BPL's prior variance on the Other's cost susceptibility (blue: small prior variance, red: high prior variance). A: BPL's posterior estimate of the Other's cost-susceptibility (y-axis) is plotted as a function of the true Other's cost-susceptibility (x-axis). B: BPL's posterior estimate of the Other's inverse-temperature (y-axis) is plotted as a function of the true Other's cost-susceptibility (x-axis).

